
Article Archive
Browse the full collection of appraisal articles, local market updates, and practice notes. Original publication dates help place each article in context.
Nevada County Real Estate Market 2025 Recap
Market Continues Stabilization as Volume Recovers
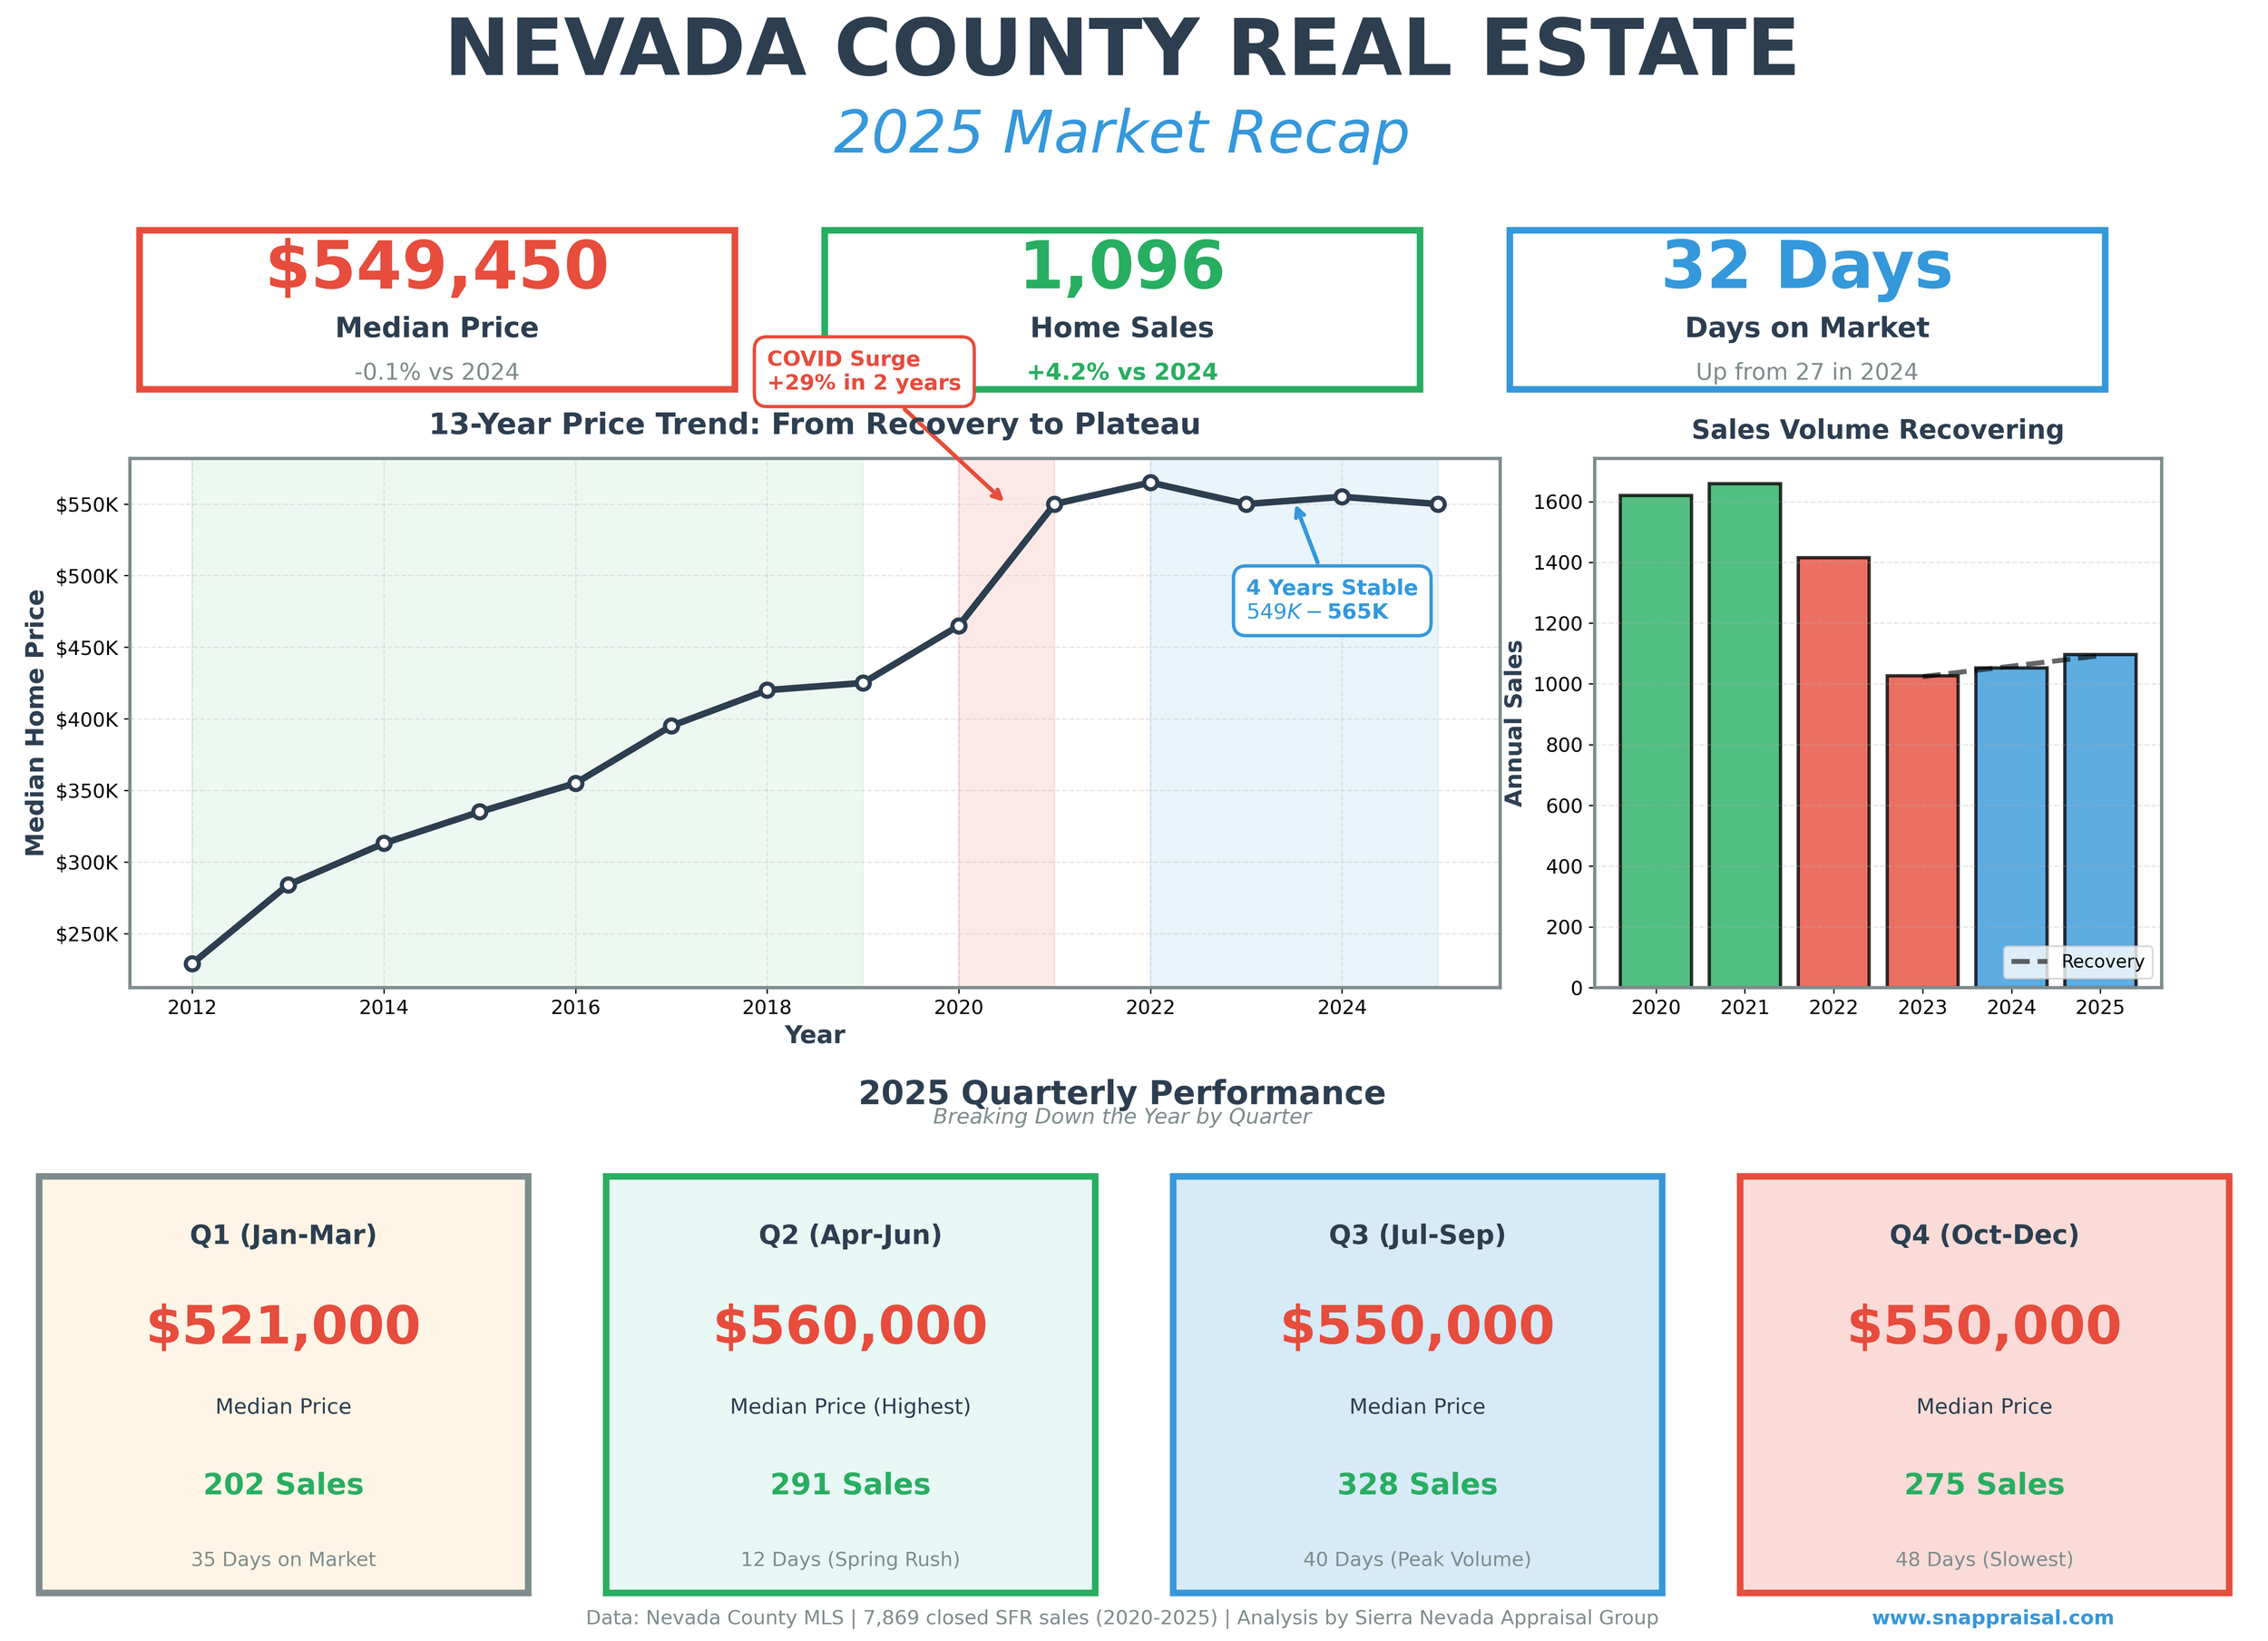
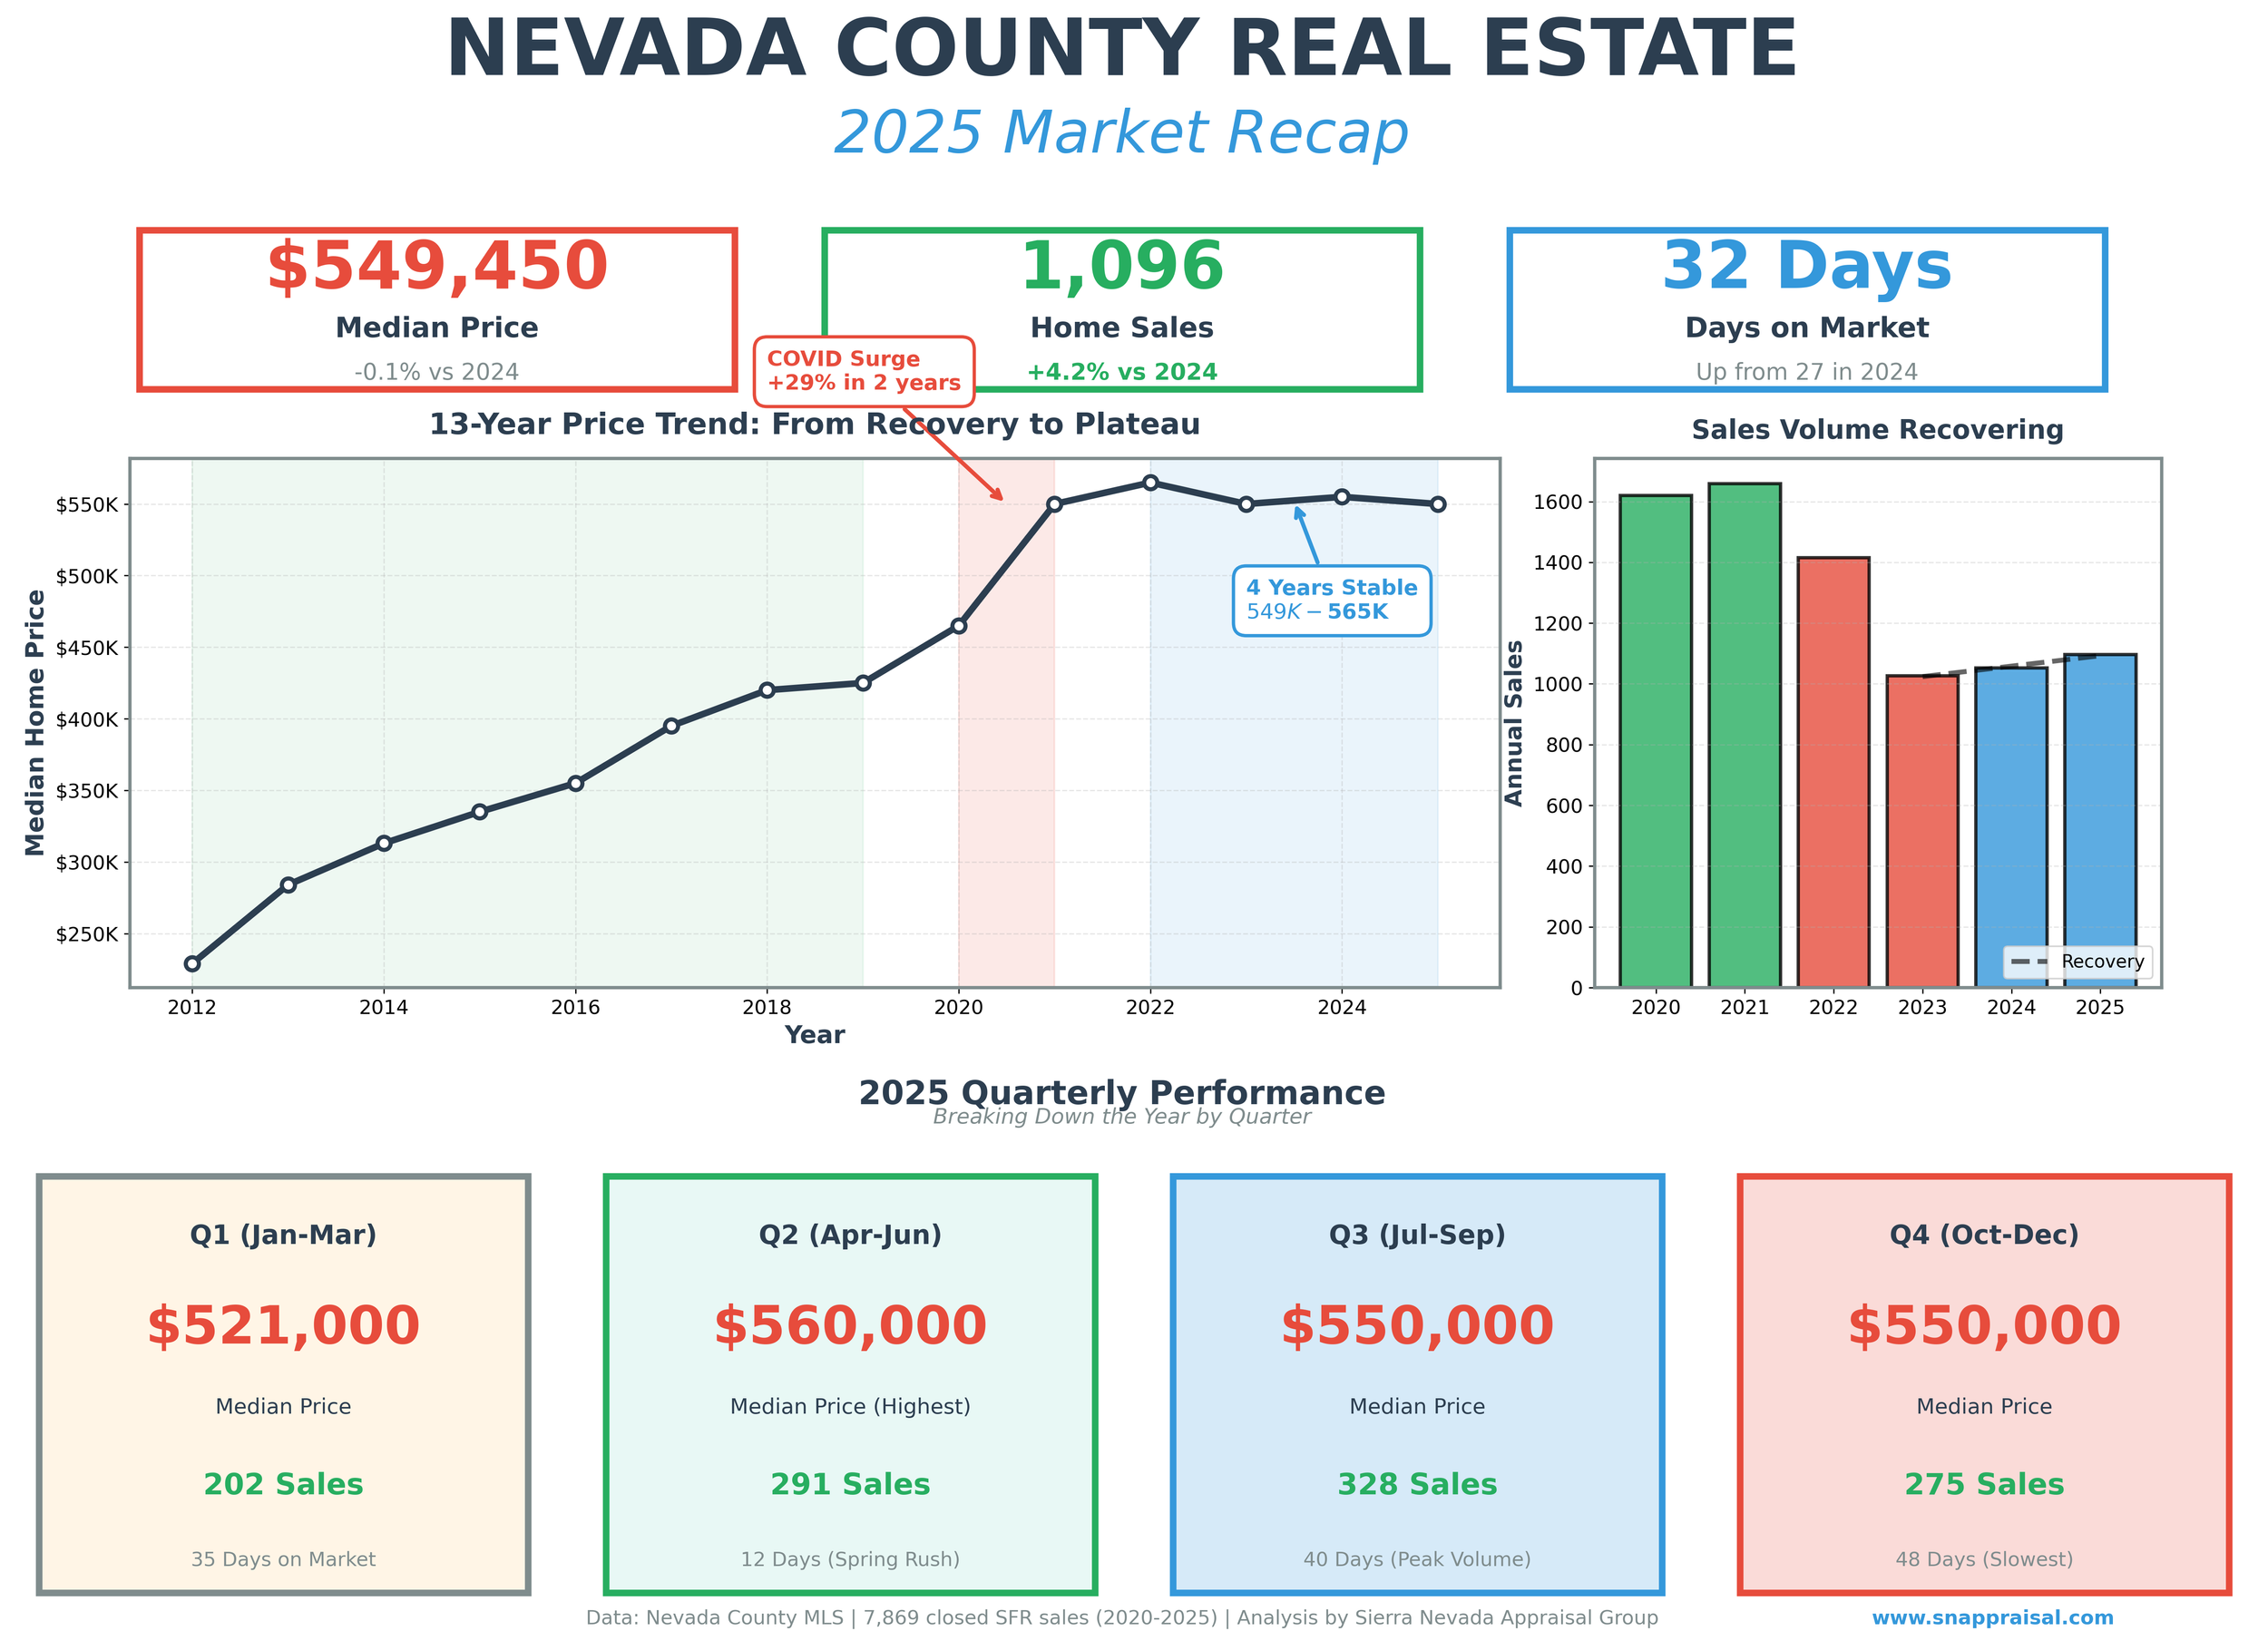
The Nevada County residential real estate market ended 2025 much as it began—stable prices near $550,000 and modestly improving sales activity. After the dramatic swings of the pandemic era and subsequent correction, the market has now settled into a multi-year pattern of price stability and gradually recovering transaction volume.
The Numbers
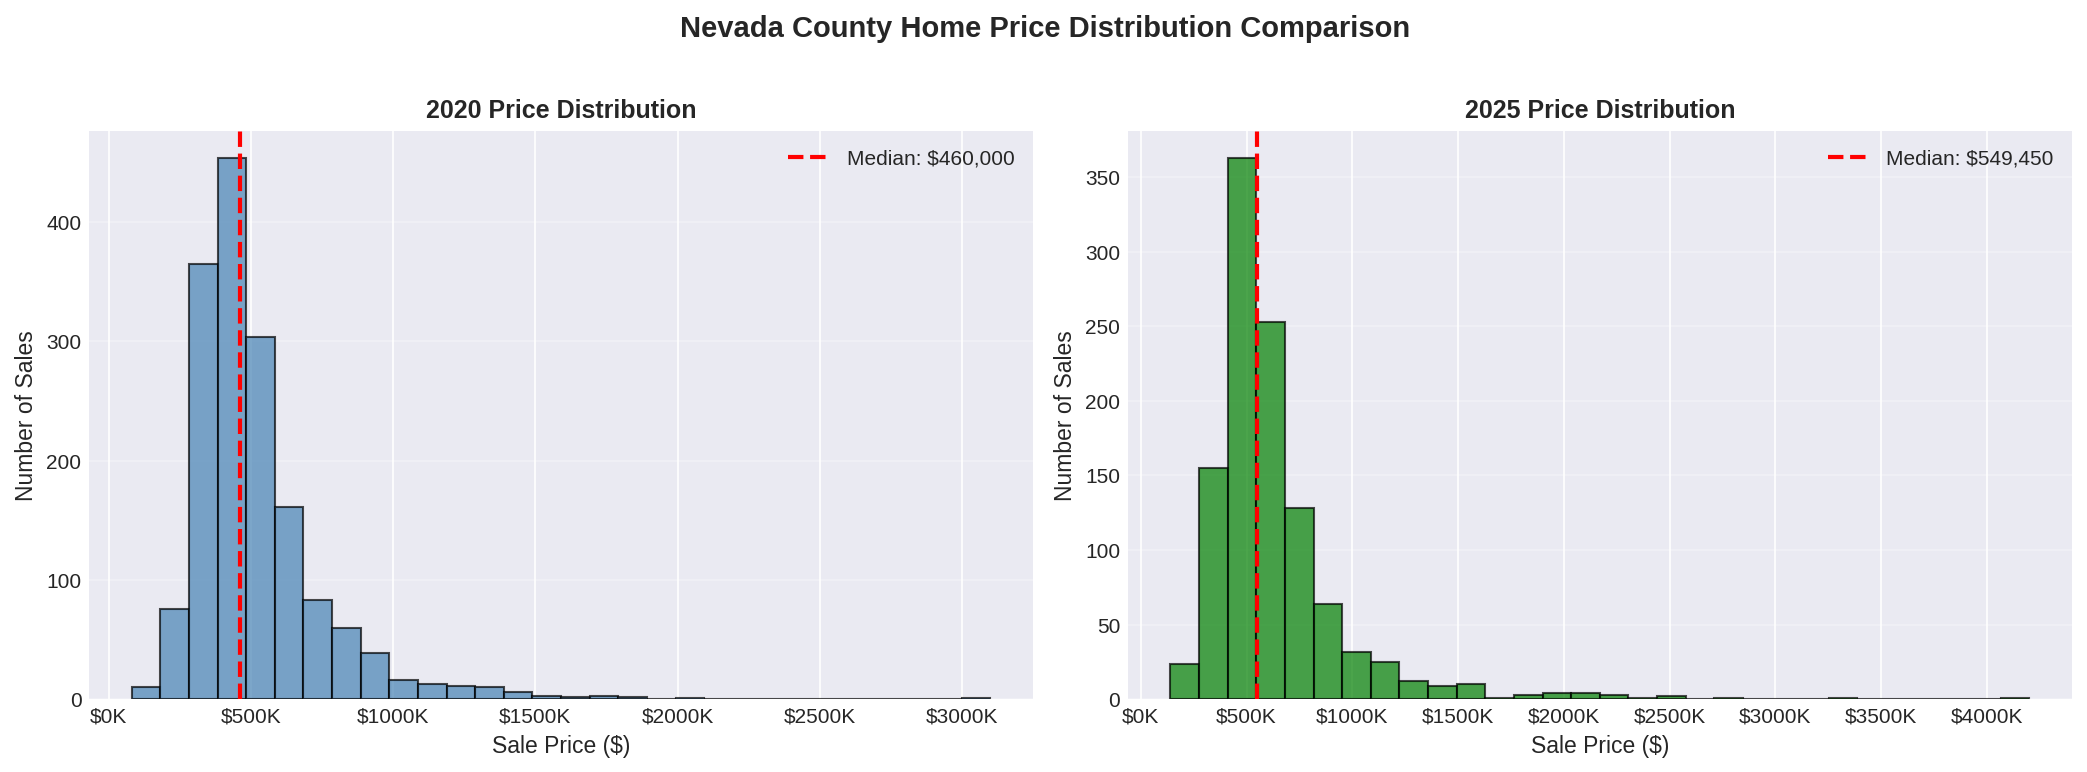
Median Home Price: $549,450
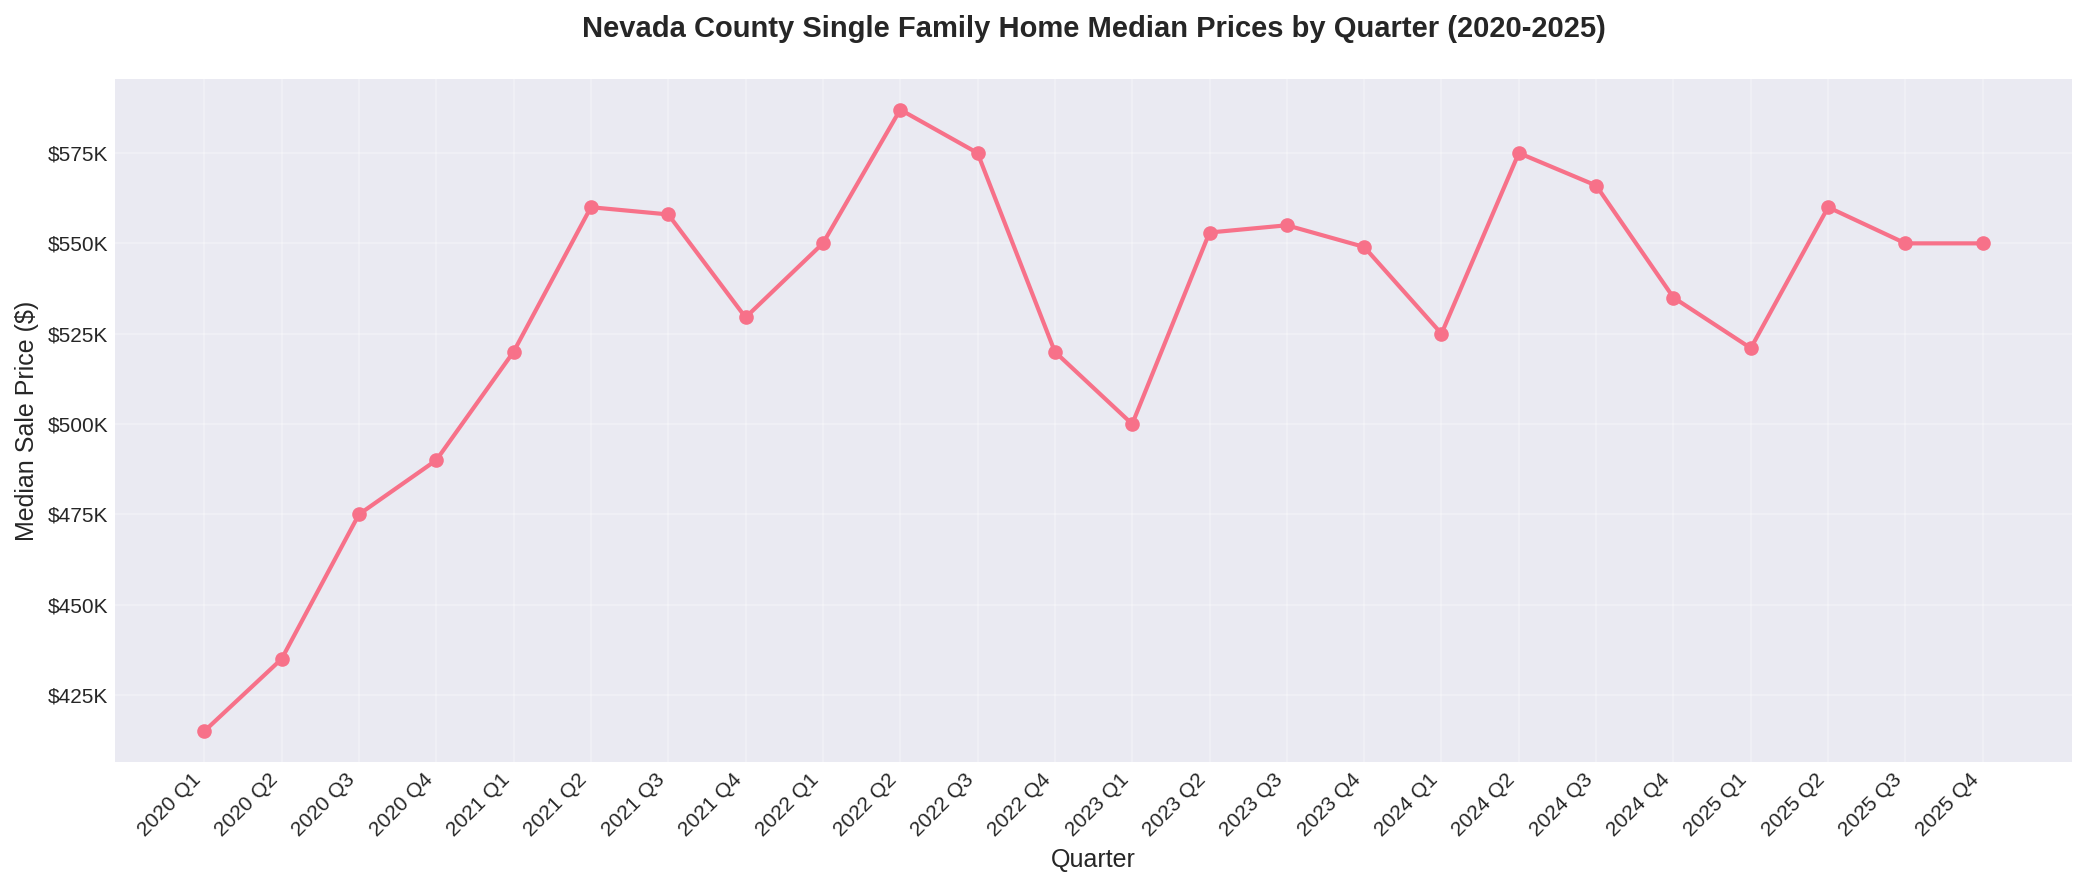
The median sale price for single-family homes in Nevada County ended 2025 at $549,450, essentially unchanged from 2024's $550,000 (-0.1%). This marks the third consecutive year of price stability following the post-pandemic correction:
2020-2021: +19.3% (pandemic boom)
2021-2022: +2.0% (peak)
2022-2023: -2.0% (correction begins)
2023-2024: +0.2% (stabilization)
2024-2025: -0.1% (continued stability)
While the market has cooled from its 2021-2022 peak, prices remain elevated compared to pre-pandemic levels. The current median of $549,450 represents a 19.4% increase from the 2020 median of $460,000—nearly all of which occurred in a single year (2021).
Sales Volume: 1,096 Transactions
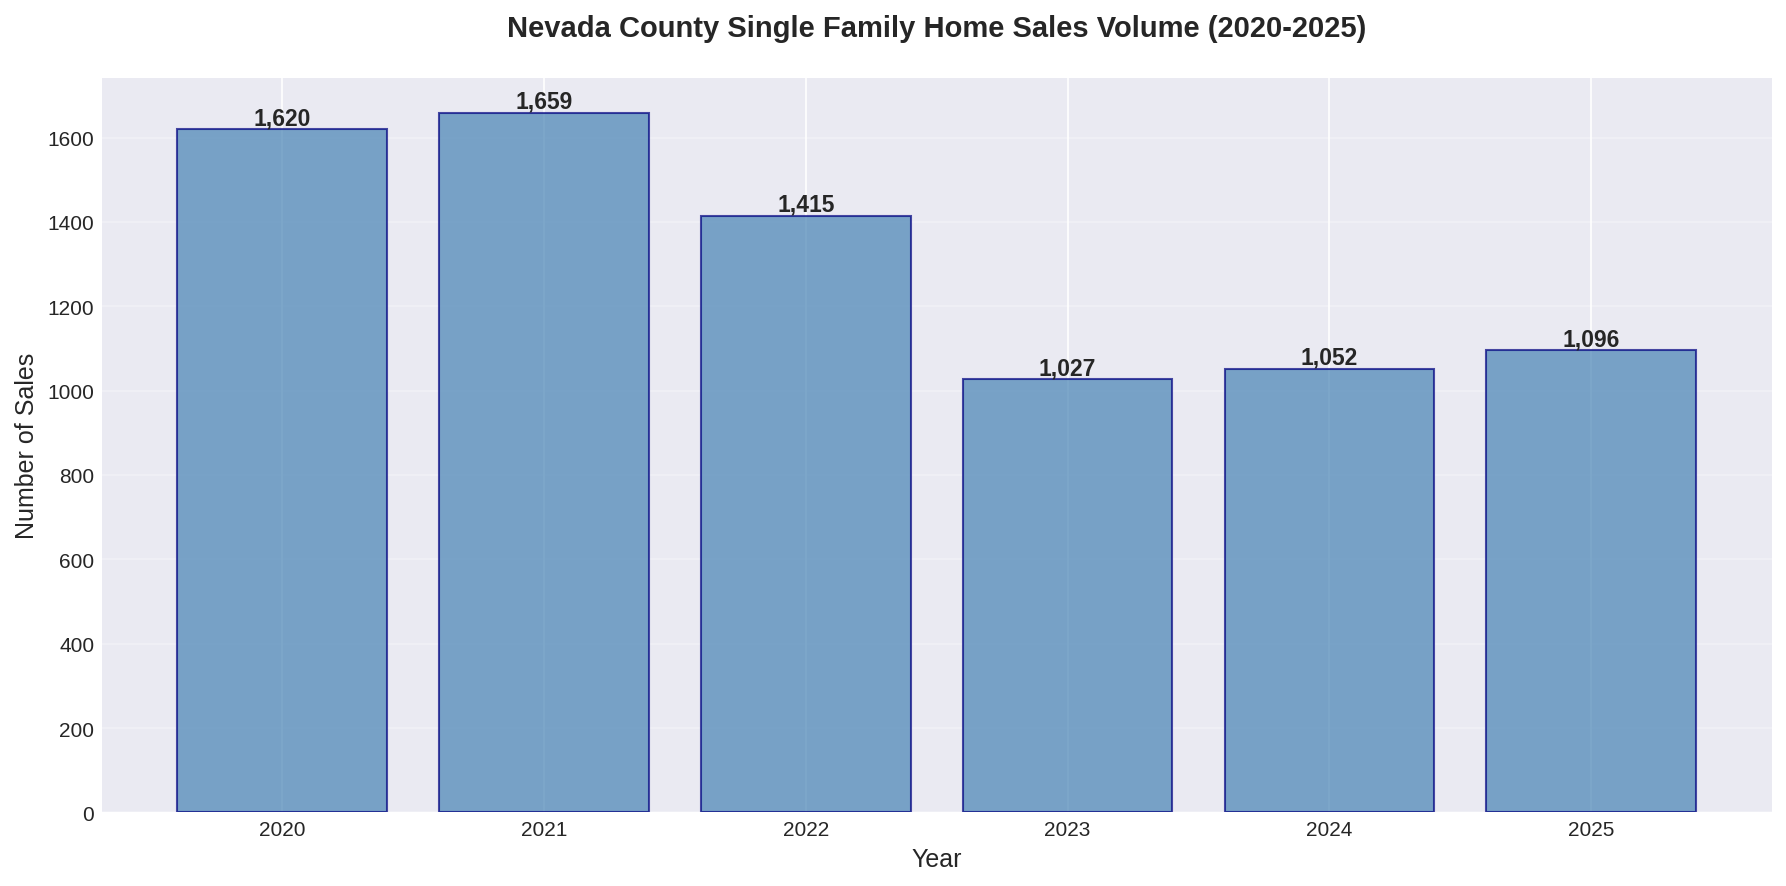
Transaction volume showed continued improvement in 2025, with 1,096 home sales compared to 1,052 in 2024—a 4.2% increase. This marks the second consecutive year of volume recovery, though we remain well below pandemic-era peaks:
2020: 1,620 sales
2021: 1,659 sales (peak)
2022: 1,415 sales (-14.7%)
2023: 1,027 sales (-27.4%)
2024: 1,052 sales (+2.4%)
2025: 1,096 sales (+4.2%)
The 2023 low point now appears to have been the bottom, with sales recovering modestly but steadily over the past two years. Still, 2025 volume remains 34% below the 2021 peak.
Looking at the Long-Term Trend (2012-2025)
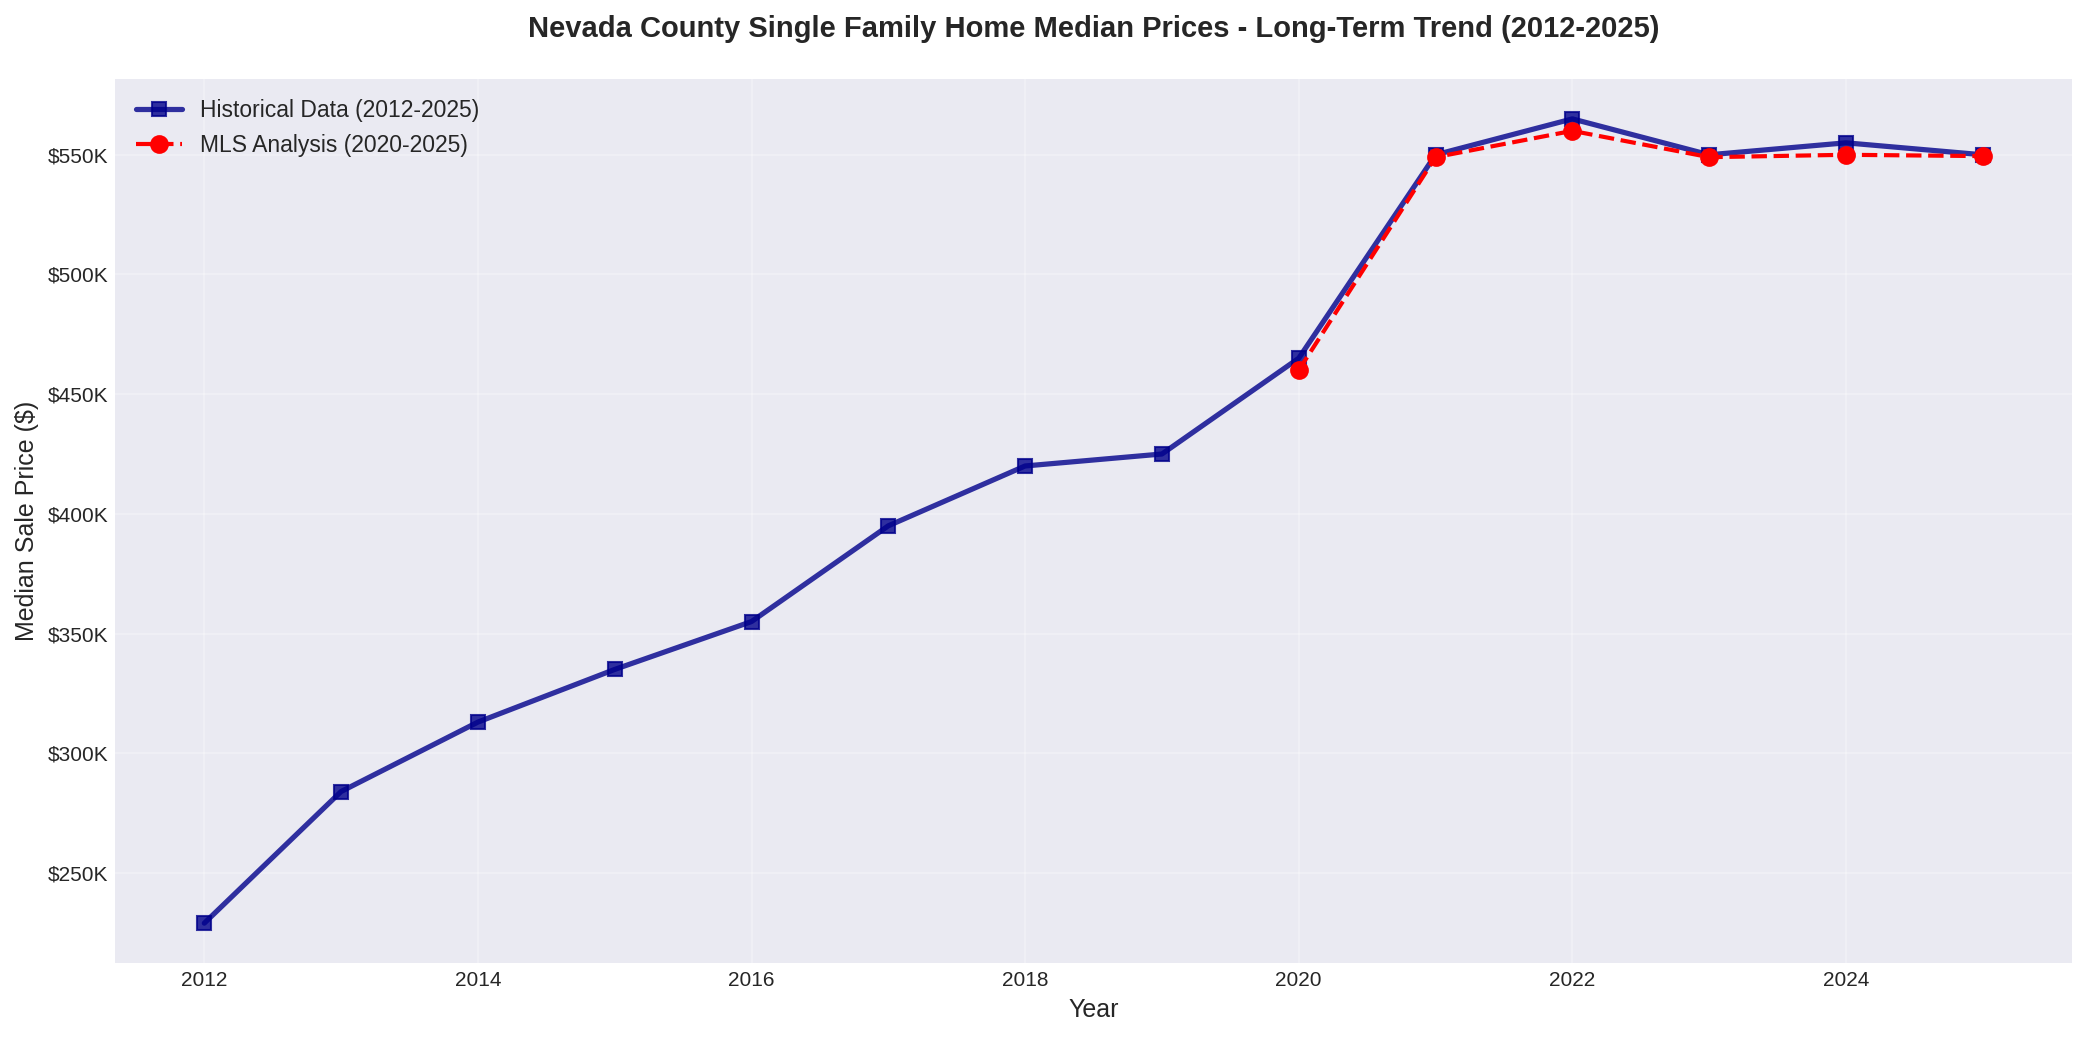
The 13-year view reveals Nevada County's complete market cycle:
2012-2019: Post-recession recovery, with median prices rising from $229,000 to $425,000—an 86% increase over seven years
2020-2021: Pandemic acceleration, with prices surging 29% in two years to $550,000
2022-2025: Extended plateau, with prices oscillating in a tight $549,000-$565,000 range for four years
From 2012 to 2025, Nevada County median home prices have increased 140%, from $229,000 to $549,450. Notably, the market has essentially moved sideways since 2022—a four-year period of stability unprecedented in the post-recession era.
Market Dynamics
Days on Market
Homes took longer to sell in 2025, with median Days on Market increasing to 32 days, up from 27 in 2024 and continuing a multi-year trend away from pandemic-era speed. For context:
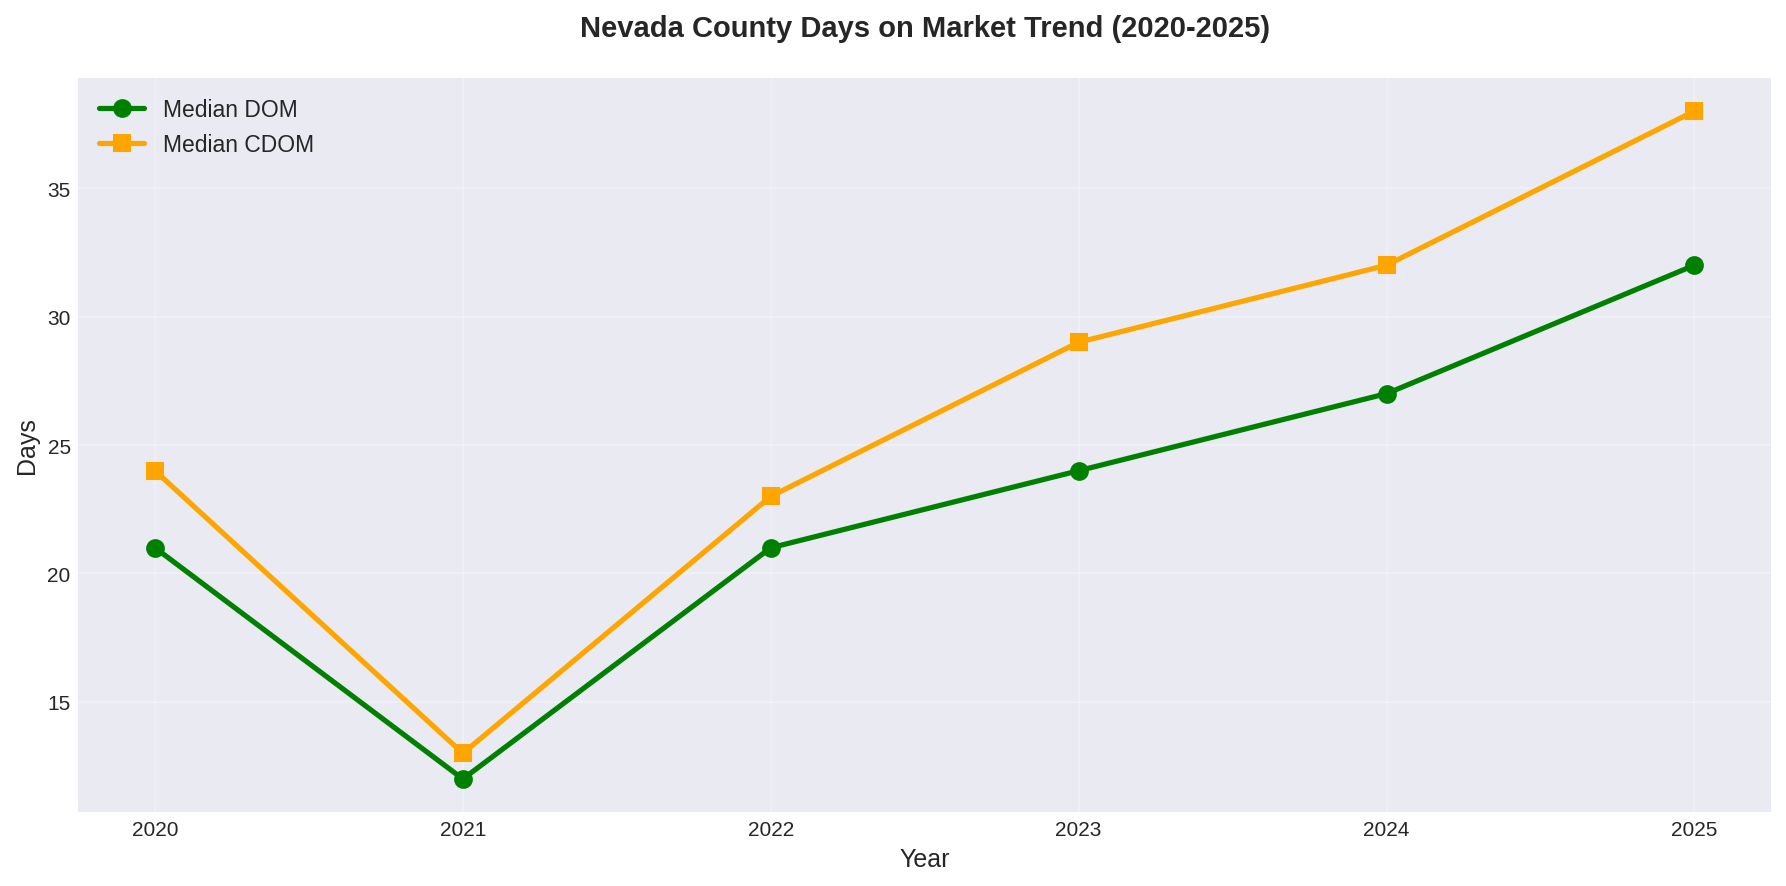
2021: 12 days (peak urgency)
2022: 21 days
2023: 24 days
2024: 27 days
2025: 32 days
The quarterly data shows pronounced seasonality:
Q1 2025: 35 days
Q2 2025: 12 days (spring rush remains strong)
Q3 2025: 40 days
Q4 2025: 48 days (slowest quarter)
Price Per Square Foot
The median price per square foot declined slightly to $305 in 2025, down from $306 in 2024 and $313 at the 2022 peak. This metric has now declined or held flat for three consecutive years after the rapid pandemic-era escalation ($248 in 2020 → $313 in 2022).
Quarterly Performance
The 2025 market showed familiar seasonal patterns with some interesting variations:
Q1: Median $521,000 (weakest), 202 sales (slowest)
Q2: Median $560,000 (strongest), 291 sales
Q3: Median $550,000, 328 sales (highest volume)
Q4: Median $550,000, 275 sales
In 2025, Q2 had the highest quarterly median price at $560,000, followed by $550,000 in both Q3 and Q4. The spring/summer season (Q2-Q3) accounted for 56% of annual sales, consistent with Nevada County's historical patterns.
What It Means
Six years after the pandemic began reshaping the housing market, Nevada County has found a new equilibrium. The data tells a clear story:
Price stability is the new normal. For four consecutive years (2022-2025), median prices have stayed within a $549,000-$565,000 band—a variation of just 3%. Compare this to the 29% surge in 2020-2021 or the steady 4-7% annual gains of the 2012-2019 recovery.
Volume is recovering, slowly. After the 2023 trough, sales have increased two years in a row (+2.4% in 2024, +4.2% in 2025). The pace suggests a gradual normalization rather than a rapid return to pandemic-era frenzy.
The market is more normal. Days on market, while lengthening, remain reasonable. Homes still sell—they just take a month instead of a week. Buyers have time to make informed decisions. Sellers who price appropriately are finding qualified buyers.
Migration Patterns Support Market Stability
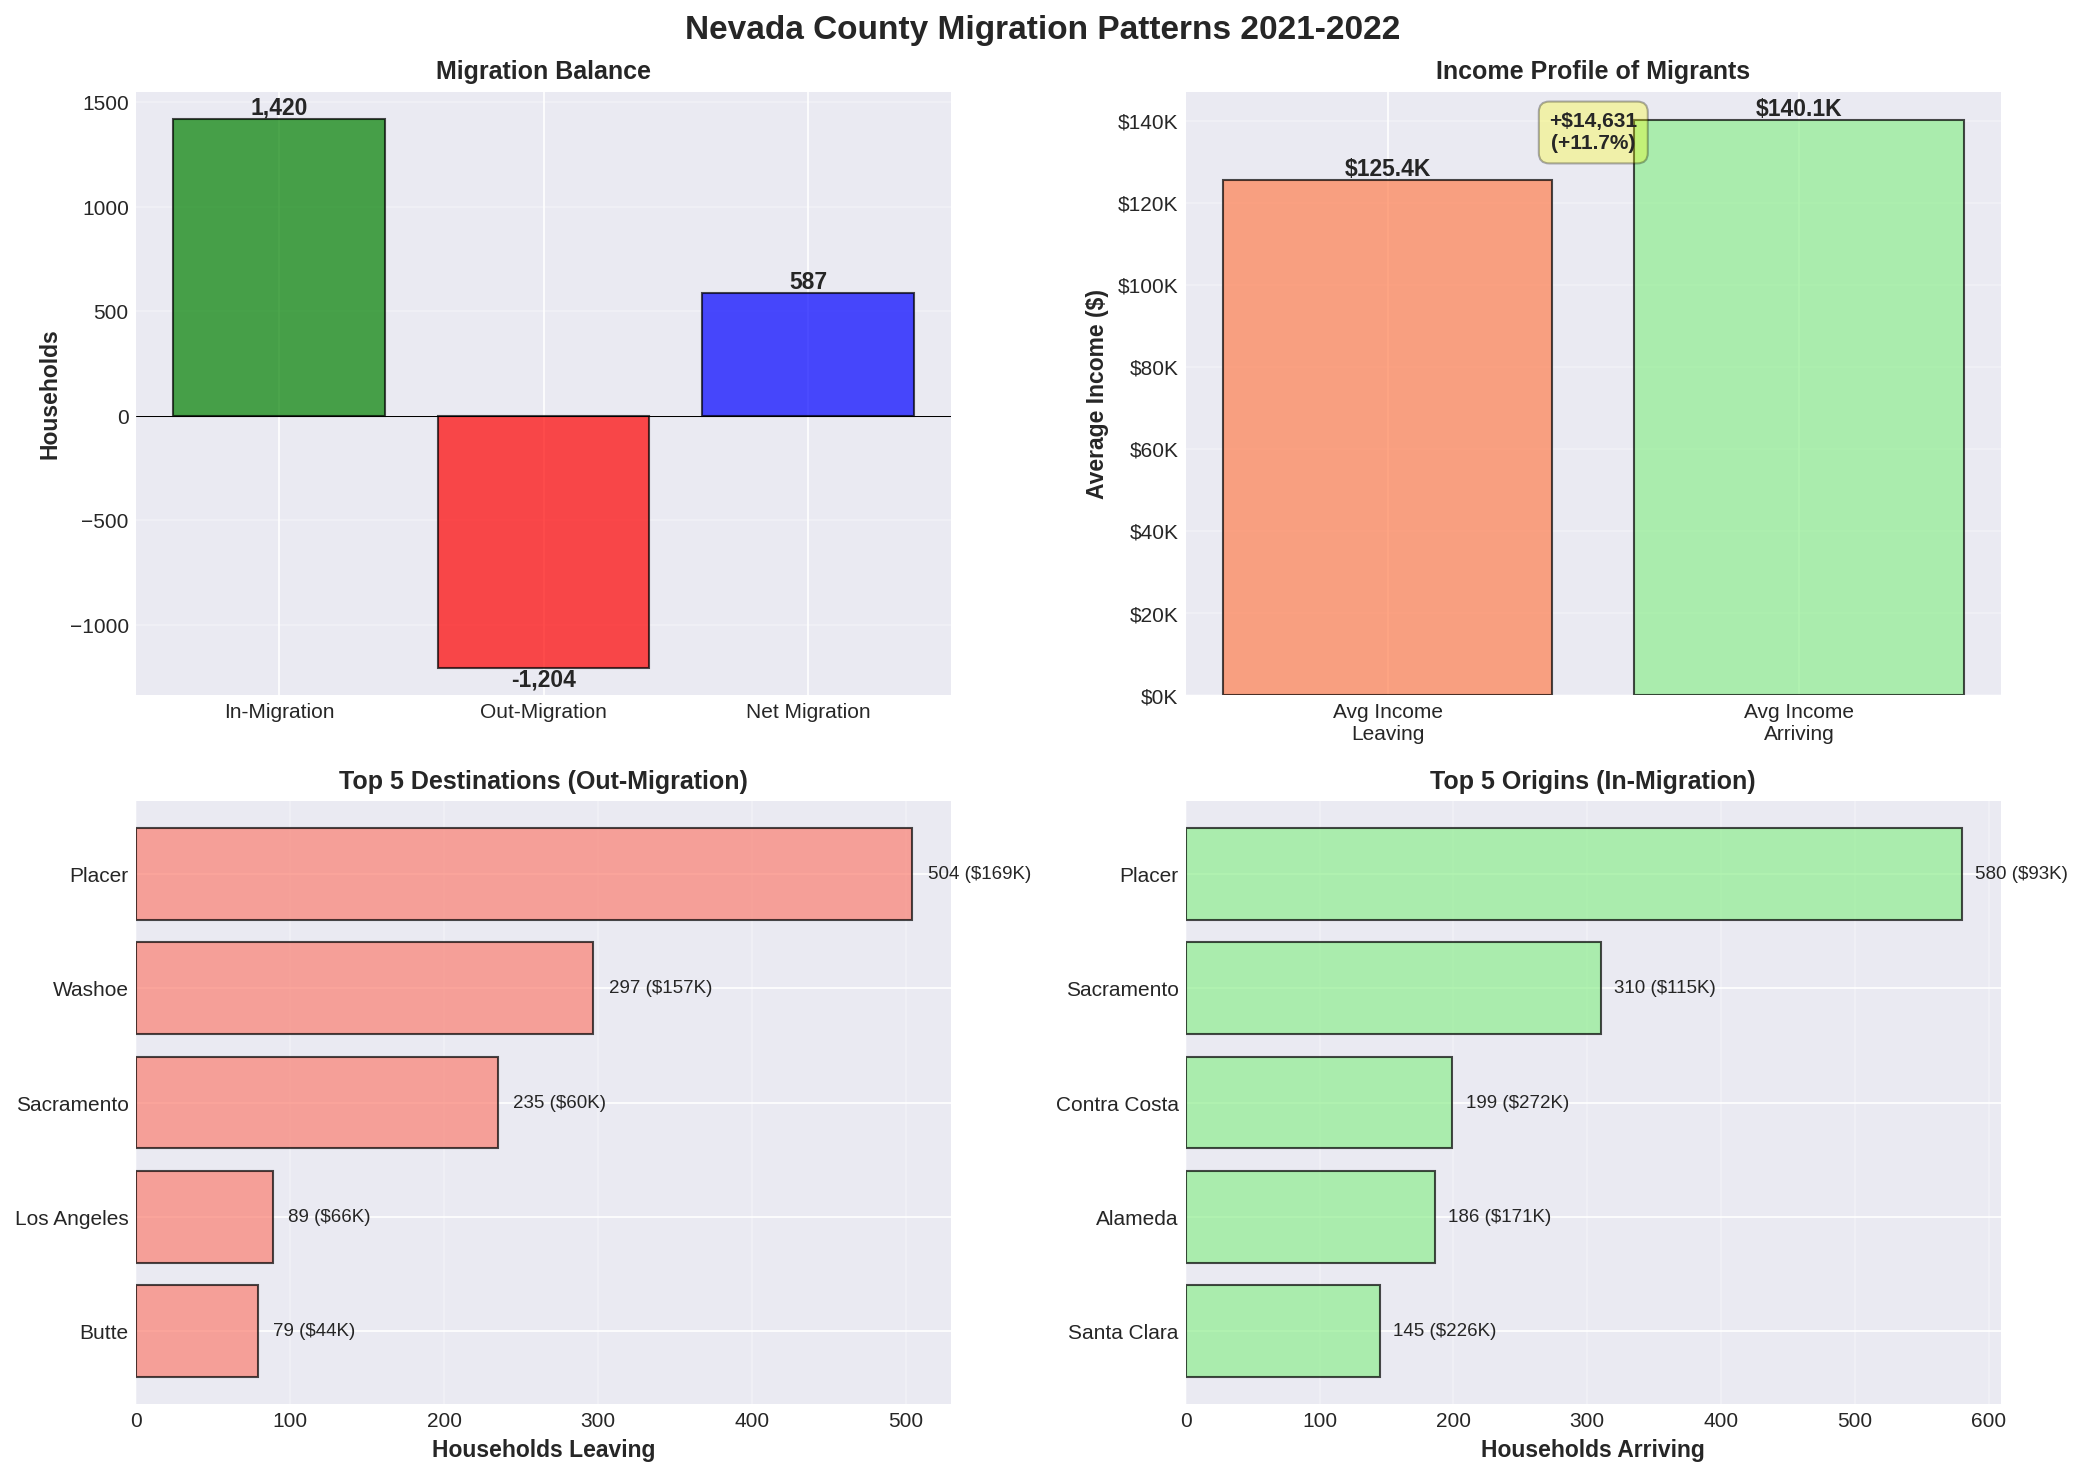
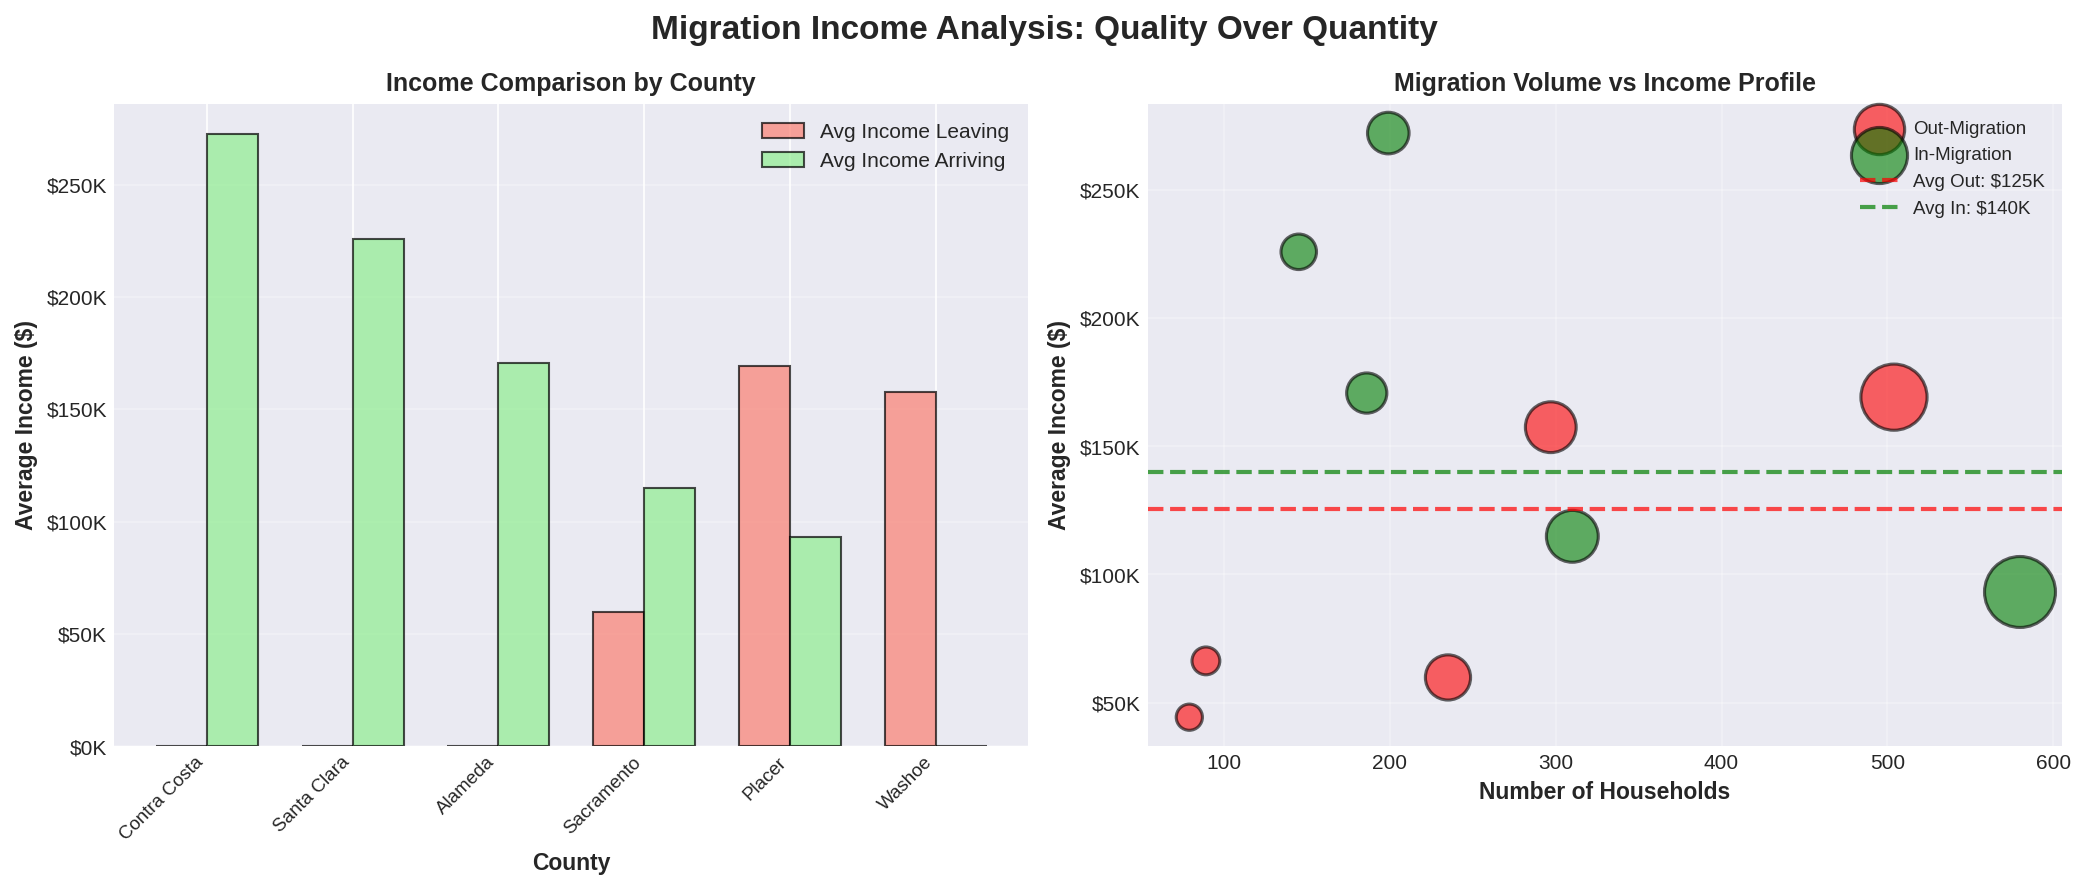
New IRS data from 2021-2022 (the most recent available) reveals the demographic forces underpinning Nevada County's market resilience. The county experienced net positive migration of 587 households, with incoming residents earning significantly more than those departing.
The Income Quality Advantage
Perhaps most telling: households arriving in Nevada County during this period earned an average of $140,067—11.7% higher than the $125,436 average of those leaving. This "quality over quantity" dynamic helps explain why home prices have remained stable despite reduced transaction volume.
Bay Area "Equity Refugees"
The data reveals Nevada County's role as a destination for high-income Bay Area residents:
Contra Costa County: 199 households arriving, $272,296 average income
Alameda County: 186 households arriving, $170,817 average income
Santa Clara County: 145 households arriving, $225,952 average income
These migrants bring substantial purchasing power—dramatically above Nevada County's median home price of $550,000—and often arrive after cashing out of million-dollar Bay Area properties.
The Placer County Exchange
The largest two-way flow is with neighboring Placer County:
580 households arrived from Placer (avg income: $93,176)
504 households departed to Placer (avg income: $169,216)
Net gain: 76 households to Nevada County
This bidirectional flow suggests lifestyle arbitrage: some Nevada County residents trade up to Placer's more urban amenities, while others arrive from Placer seeking Nevada County's more rural character at a relative discount.
Sacramento Metro Connection
Nevada County gained 75 net households from Sacramento County, with those arriving ($114,903 average) earning nearly double those departing ($59,817). This pattern reinforces Nevada County's position as an "upgrade" destination for Sacramento-area residents.
Timing Matters
Critically, this 2021-2022 migration data captures the peak of Nevada County's pandemic price surge—precisely when the market needed demand most. While we don't yet have 2023-2024 migration data, if patterns held even partially, they would help explain why prices stabilized rather than corrected more sharply when interest rates rose.
Key Takeaways for 2025:
Buyers: A more balanced market with time to shop, but no price relief in sight
Sellers: Realistic pricing and patience required; premium pricing opportunities rare
Market: Transitioning from "recovery from correction" to "new normal"
Looking ahead to 2026, the fundamentals suggest continued stability. Nevada County's lifestyle appeal, limited inventory, and strong local employment support prices. But the urgency-driven appreciation of 2020-2021 appears to be behind us. Barring major economic disruption or dramatic interest rate changes, expect more of what we've seen: prices holding near current levels, volume gradually improving, and a market that rewards patience over panic.
Understanding Submarkets
These metrics represent the entire western Nevada County market as a whole. It's important to remember that homes typically compete within a submarket—not the entire county. In every appraisal project I work on, a careful analysis is completed with a minimum analysis on a county level, area level, and the competitive market for properties that directly compete with the property being appraised. Your home's value is most influenced by its immediate competition: similar homes in your specific neighborhood, school district, or geographic area. Market-wide trends provide context, but submarket conditions determine actual values.
Data based on Nevada County MLS closed sales of single-family residences, 2020-2025. Analysis includes properties priced between $50,000 and $5,000,000. 2025 data reflects sales through December 31, 2025.
Hiring the Right Appraiser for a Divorce, What Really Matters
Divorce often begins with cooperation and good intentions. Many couples start the process believing issues will be resolved through agreement or mediation.
Experienced attorneys know that circumstances can change.
Real estate value frequently becomes a focal point as cases progress. Matters that begin amicably can move into formal litigation with little warning. When that happens, an appraisal that was sufficient for discussion may suddenly be examined by opposing counsel, challenged by another appraiser, or reviewed directly by a judge.
A divorce appraisal should always be prepared with that possibility in mind.
Divorce Cases Can Change Direction Quickly

When real estate becomes evidence, clarity and credibility matter.
When parties first look for an appraiser, cost and turnaround time often feel like the most important factors. At that stage, few expect the appraisal to become contested evidence.
However, once positions harden, the appraisal often becomes central to negotiations or trial. Reports may be scrutinized line by line, assumptions questioned, and conclusions challenged.
For that reason, divorce appraisals should be developed as though they may be reviewed in court, even if the case appears cooperative at the outset.
Independence and Objectivity Are Essential
In divorce matters, the appraiser does not work for one side or the other. The appraiser works for the assignment.
Promises of a high value, a low value, or a value that supports a particular position may sound appealing, but they often create credibility problems later. Judges and attorneys are quick to identify advocacy disguised as analysis.
A credible appraisal is neutral. It may not fully satisfy either party, but it is defensible to all decision makers. That neutrality is what gives the appraisal weight.
Property Condition Disputes, The Most Common Reason Divorce Appraisals Are Challenged
Disagreements over property condition are the single most common reason divorce appraisals are challenged.
Typically, one party believes the home is in good or even excellent condition. The other may present a detailed list of defects, sometimes extensive, sometimes overlapping, and sometimes contradictory. These differences are common in divorce and entirely understandable.
From an appraiser’s perspective, the question is not who is right. The question is how the market would react.
Condition Is a Market Question, Not a Personal One
Appraisers do not take sides in condition disputes. Our role is to analyze how a typical buyer would view the property in its current state.
Some items are routinely accepted by the market and absorbed into the overall condition of a home. Others are commonly addressed through repair credits during escrow. In more serious cases, a property may only be marketable “as is,” often to investors who factor repair costs, uncertainty, and risk into their required return.
Determining where a property falls on that spectrum requires judgment, experience, and supporting data.
Reconciling Conflicting Repair Estimates
In many divorce cases, each side obtains repair estimates. These estimates can vary widely, even when prepared by licensed professionals.
In one Grass Valley appraisal, I reviewed and reconciled twenty seven separate repair estimates. Some indicated the property required a complete foundation replacement. Others concluded that only minimal repairs were necessary, or that no repairs were required at all.
My task was not to select the highest or lowest estimate. It was to determine how a typical buyer would interpret the condition, risk, and uncertainty associated with the property, based on market behavior and comparable sales.
That reconciliation process is often where divorce appraisals are most heavily scrutinized.
When Expertise Beyond Appraisal Is Required
Occasionally, parties or attorneys question an appraiser’s ability to evaluate certain defects, particularly when the issue involves specialized construction or engineering concerns. This is a reasonable question.
Appraisers are not licensed contractors or engineers, which is why reputable cost estimation tools are used and, when necessary, estimates and reports are obtained from licensed local professionals. In complex cases, multiple opinions may be reviewed and reconciled to understand the range of market perception.
In one assignment, foundation settlement was apparent during inspection. At least one engineer declined to prepare a report due to the complexity of the issues and instead recommended a forensic engineering inspection. That type of inspection was costly and time consuming, but it highlighted the level of uncertainty a buyer would face.
The appraisal analysis reflected that uncertainty, because buyers factor unknowns into value, even when precise answers are not immediately available.
Costs to Cure and Costs to Complete
Not all condition issues involve damage. Some involve unfinished work.
In a South Lake Tahoe appraisal, a remodel had not been completed at the effective date of value. That required estimating the cost to complete the project in a way that reflected local labor conditions, realistic timelines, and market expectations.
When I develop cost estimates personally, I rely on multiple cost estimation sources and discussions with local contractors and professionals. This approach helps ensure conclusions are reasonable, supportable, and consistent with how buyers and investors evaluate unfinished projects.
Why Scope, Fees, and Timelines Vary
Every divorce appraisal is different. Some properties require minimal condition analysis. Others require extensive investigation, reconciliation of conflicting information, and input from additional professionals.
This is why divorce appraisal fees and timelines can vary significantly. The scope of work is driven by the complexity of the property and the issues involved, not by a standard template.
Attempts to oversimplify complex condition issues often lead to delays, second appraisals, or additional litigation costs later in the process.
When Two Appraisers Disagree, Credentials Matter
In contested cases, each side may retain its own appraiser. When opinions differ, courts must determine which analysis is more credible.
Beyond the data itself, judges often consider education, licensing level, professional designations, continuing education, and experience with litigation related assignments. When analyses are close, qualifications and clarity of explanation can become decisive.
Final Thoughts
A divorce appraisal is more than a number. It is evidence.
Choosing an appraiser based solely on cost or speed can create risk if a case becomes contested. Selecting an appraiser with experience in divorce work, strong credentials, and a clear understanding of how buyers react to condition issues helps ensure the valuation remains credible, no matter how the case unfolds.
Even when a matter appears straightforward, preparation is not pessimism. It is professionalism.
Still Appraising, Still Curious, And Slightly Short on Free Time
Between courtrooms, wildfire damaged properties, estate work, and a toddler who insists on helping me type, life has been full. This is a brief look at recent appraisal work and what’s ahead.
It has been a few years since my last blog post, which feels like both a long time and no time at all. If you have ever meant to write more often but got busy actually doing the work, you understand.
So, here’s a brief update on what I’ve been up to and why you’ll be seeing more from me here as we head into 2026.
Staying Busy, In the Real World
Over the past few years, I’ve continued working on a wide range of appraisal assignments, many of which have found their way into courtrooms. I’ve testified in cases involving neighboring property owners disputing landscaping impacts, and in matters between a former buyer and real estate professionals related to alleged nondisclosure of defects.
I’ve also testified in several divorce trials involving vacant land, single family homes, and even an environmentally contaminated property that was part of an EPA Superfund site. Those assignments are never simple, but they are a reminder of how important careful analysis and clear explanation can be when real estate becomes evidence.
Outside of litigation, I’ve appraised commercial properties in downtown Grass Valley and Truckee for estate settlement, along with multi family properties throughout Nevada and Placer Counties.
And then there are the assignments that remind me why this work can still be fun.
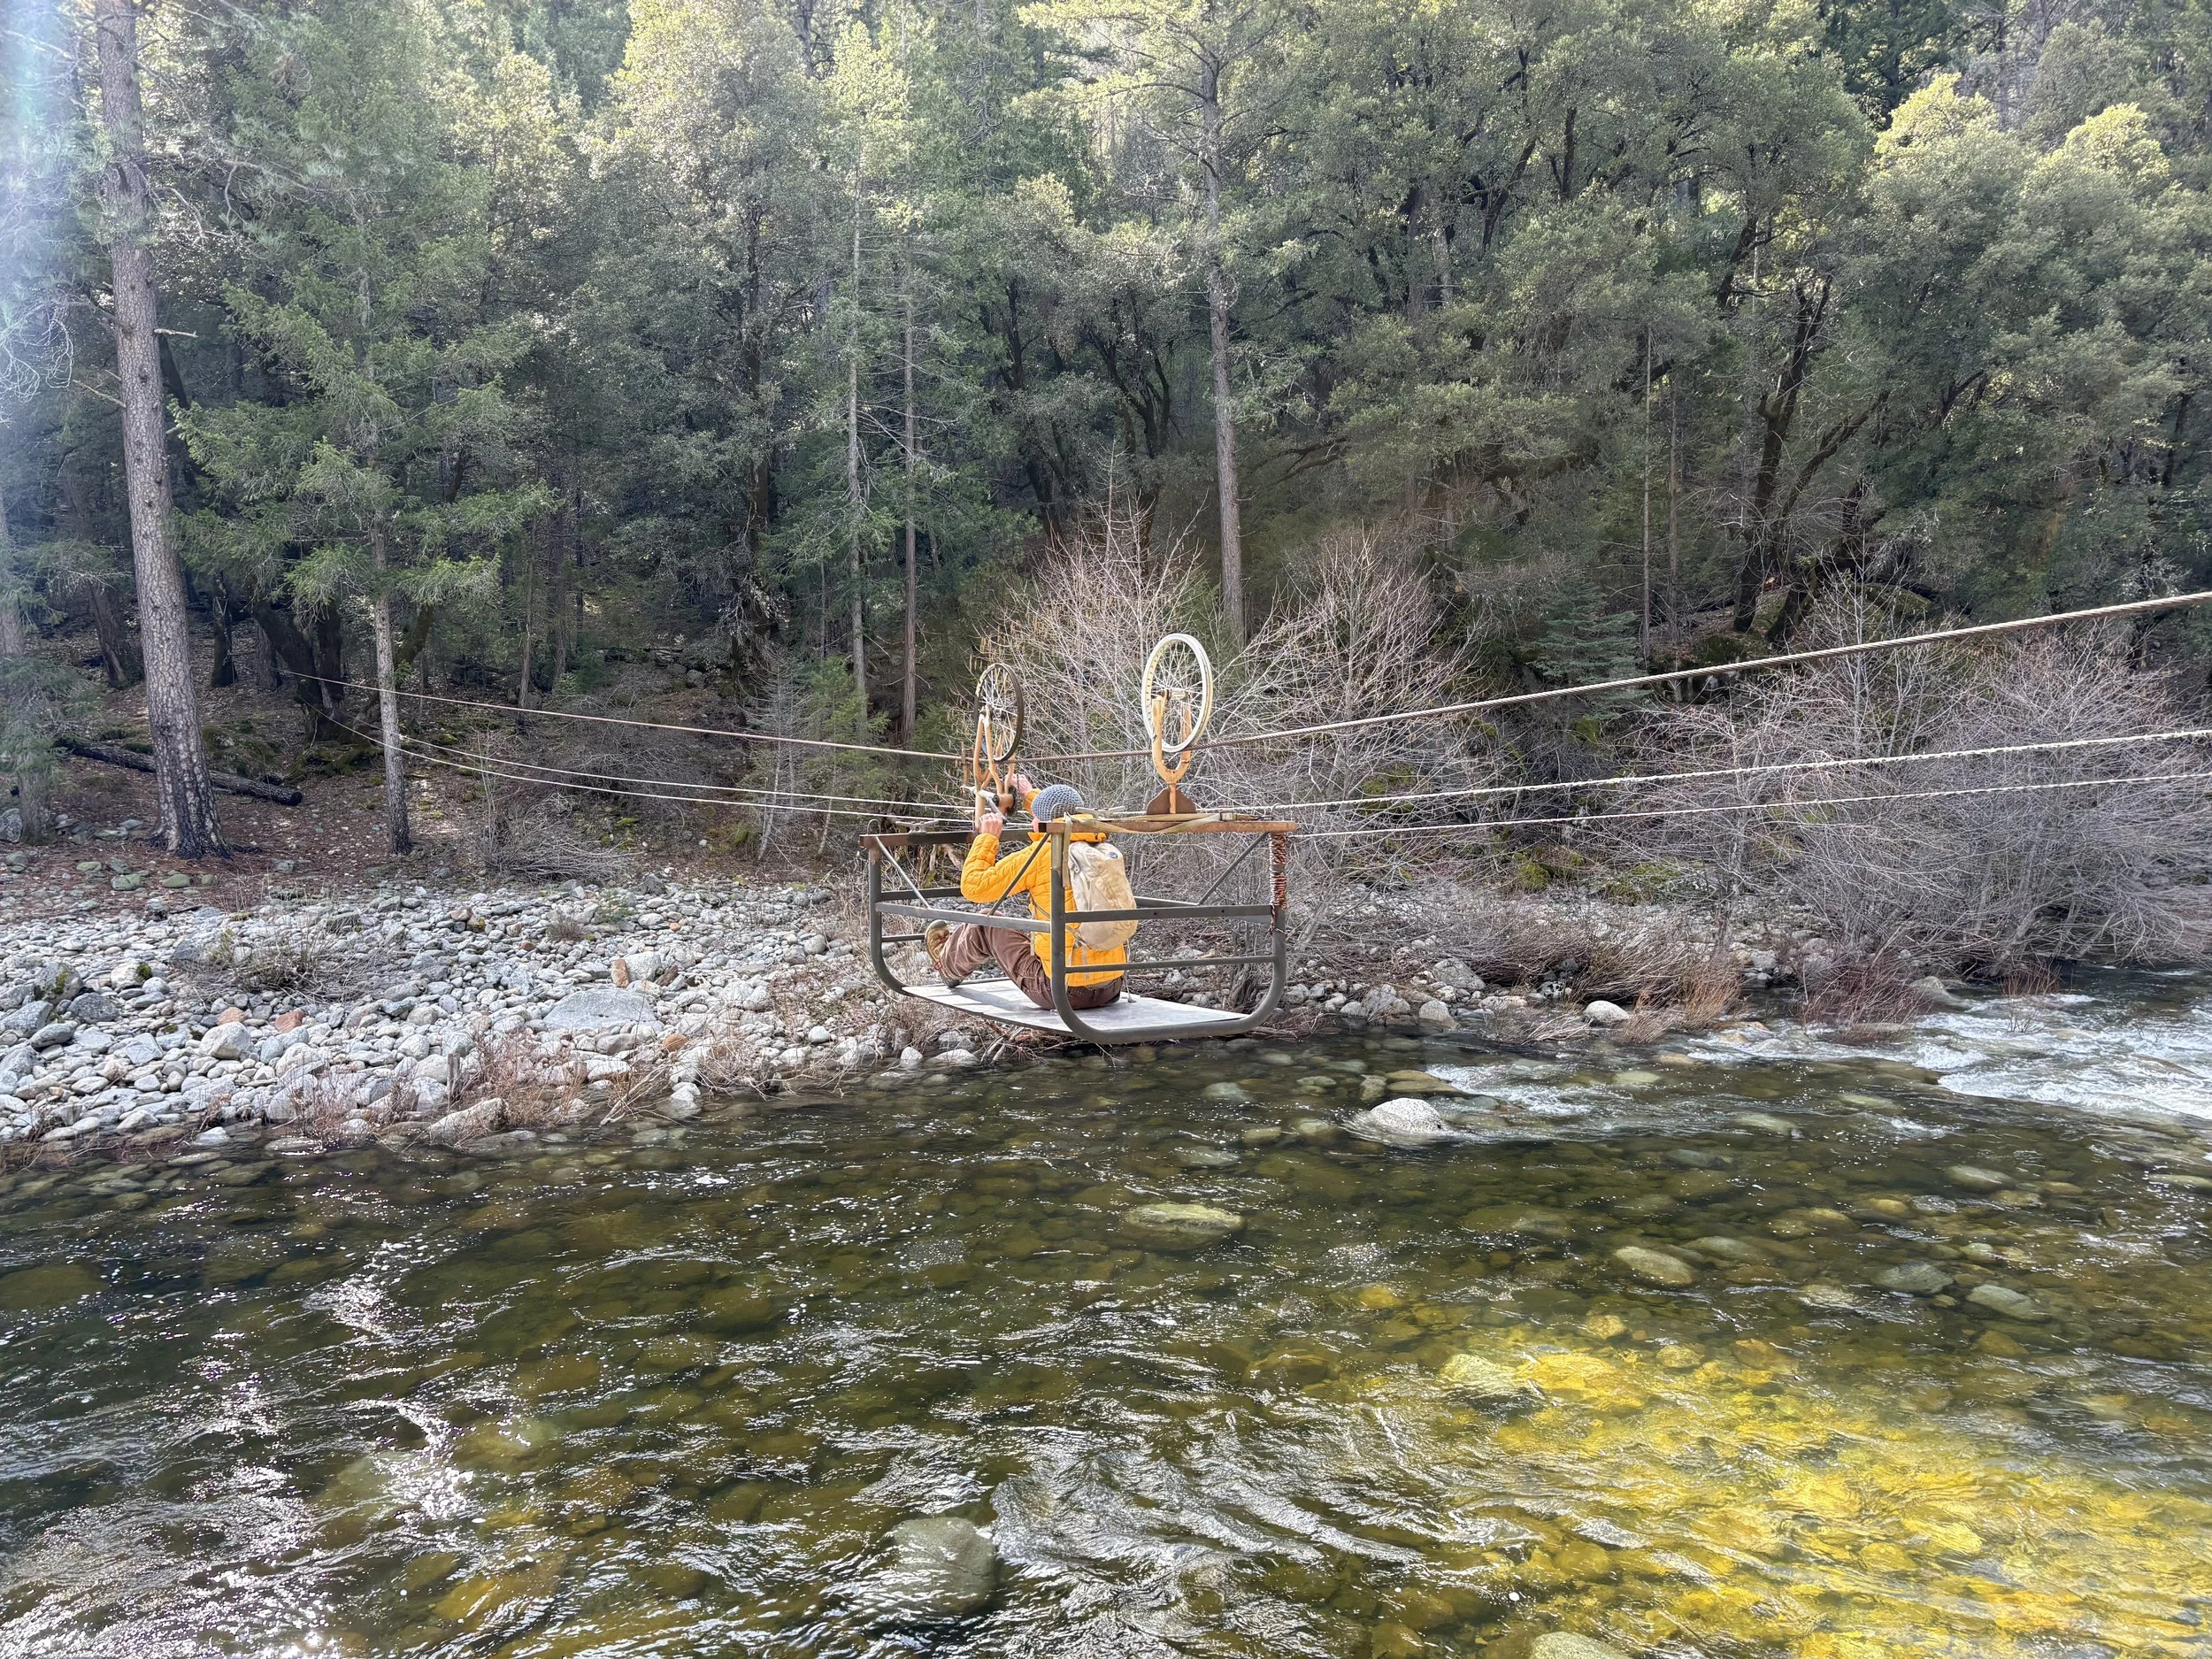
One memorable project involved appraising nearly 100 acres on both sides of the Yuba River in a spectacular setting. The property was a former gold mine, and the only way across the river was by suspended cart. Not something you see in a typical suburban inspection, and definitely not covered in the licensing exam.
Fire, Recovery, and Resilience
I’ve also continued to appraise properties impacted by wildfires, including a fly fishing preserve along the Middle Fork of the American River and agricultural fields along the Sacramento River. These assignments require sensitivity, patience, and an understanding that value is often tied to recovery as much as current condition.
They are challenging, important, and humbling pieces of work.
Staying Involved and Giving Back
In addition to appraisal work, I’ve remained active with the Appraisal Institute and the Real Estate Appraisers Association. I’ve taught continuing education courses and spoken at regional conferences, which is one of the best ways to stay sharp and connected in an ever evolving profession.
Teaching has a way of making me double check my own understanding, and occasionally reminding me that valuation theory is best learned with coffee.
The Most Important Update
Most importantly, I’ve had the privilege of watching my young daughter grow into a full fledged toddler. She’s almost two now, walks confidently, talks constantly, and loves to “help” me work by enthusiastically banging on the keyboard.
She’s not quite measuring houses yet, but she is very serious about typing. Progress takes many forms.
Looking Ahead
As we move into 2026, I plan to be more active here. I’ll be sharing insights on appraisal work, litigation support, divorce valuations, and market observations, written for property owners, attorneys, and anyone who wants a clearer understanding of how real estate value is actually determined.
Thanks for reading, and thanks for sticking around. More to come.
If you ever hear unexplained keyboard noises in the background, it’s probably my assistant. She works in snacks and giggles.
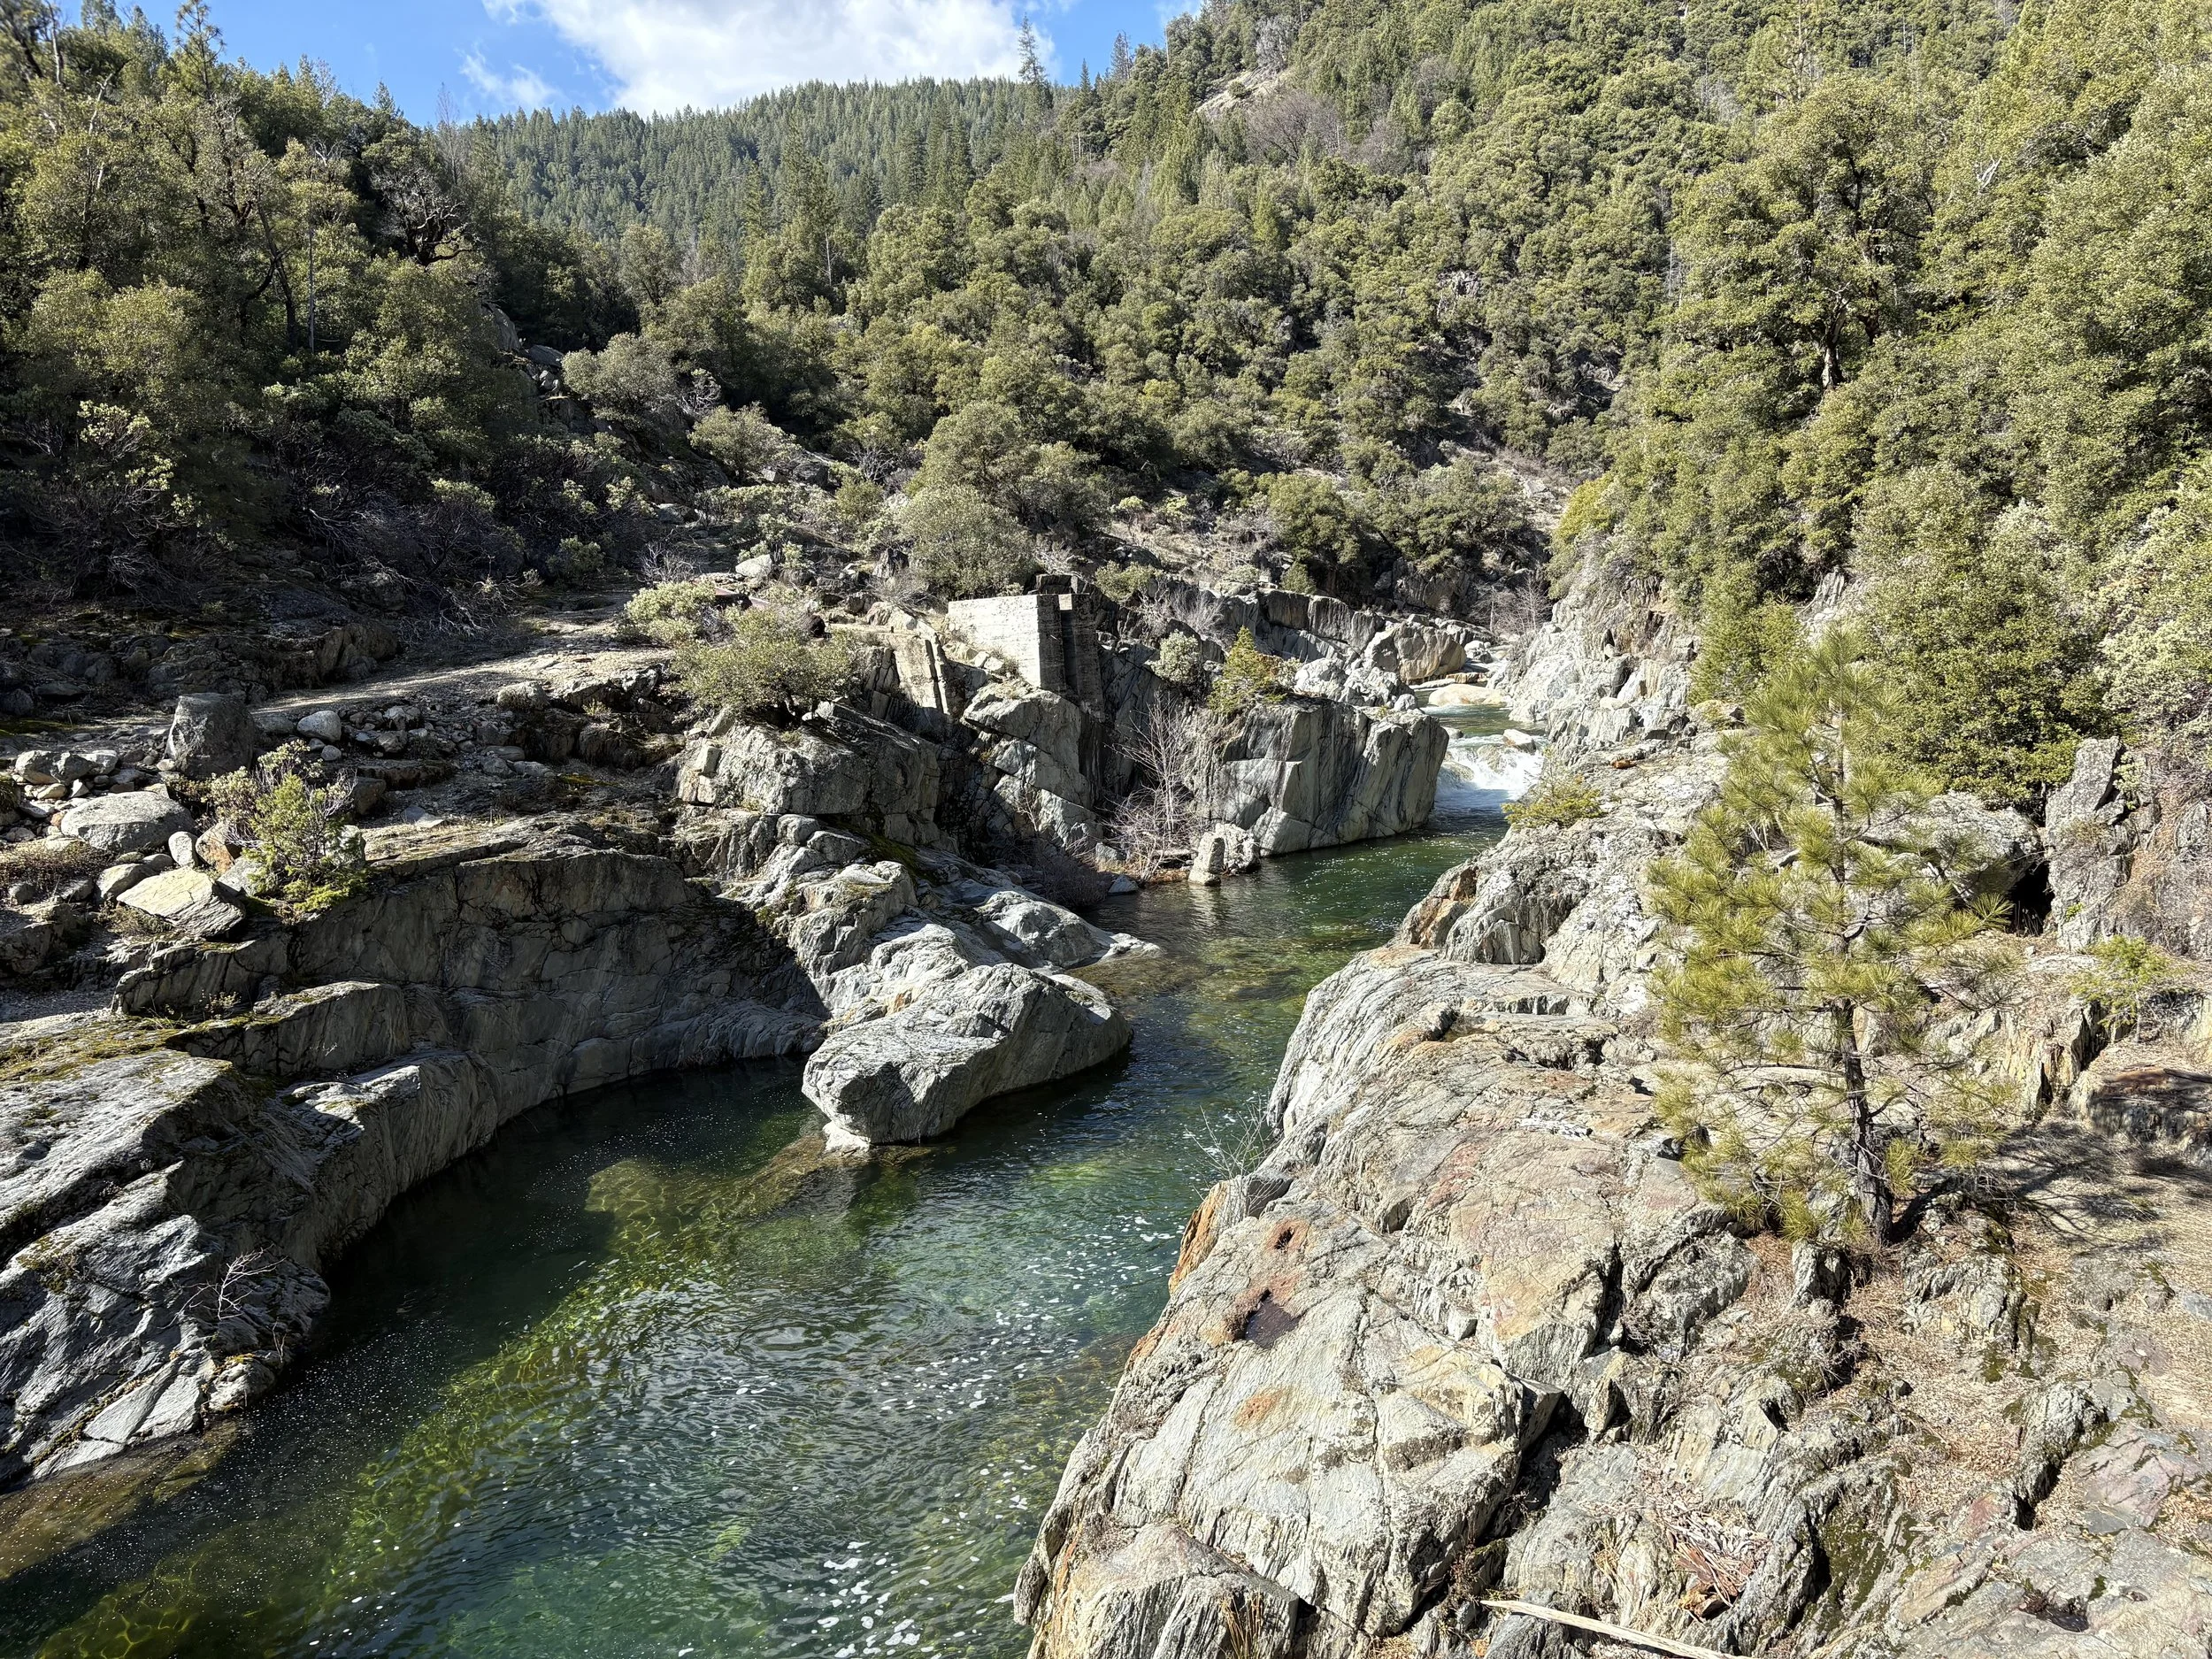
The Beautiful South Fork Yuba River

Wildfire Devastation along the Middle Fork American River

My Daughter and I walking in Nevada City
Should I Get A Property Appraised When Someone Dies?
Losing a loved one can be one of the hardest situations one must deal with. Not only are there the emotions of dealing with a loss, but there are also several other financial aspects that need to be resolved. Decisions on real estate could be one of those aspects. Should the family sell a property immediately? Can a surviving spouse handle the maintenance of the property? Should the property be appraised?
An appraisal can be useful in several ways. Sometimes the value of the asset is unknown, and an appraisal can help a family make decisions about the future. Maybe another family member would like to purchase the property and there is a need to decide on a purchase price. Often, beneficiaries disagree on the value of a property in a trust, especially if some of the beneficiaries live out of the area and don’t understand the complexities of the Nevada County real estate market. Or possibly there is a loan on the property, or a reverse mortgage and the family needs to know how much equity is in the property. An appraisal can help with all of these situations.
What about taxes?
There are several different types of taxes on real estate. Property Taxes in California are handled by the County Assessor. (Here’s a link to the Nevada County Assessor and Placer County Assessor). The Assessor’s Office must be notified upon the death of a property owner within 150 days of the date of death, or if the estate is probated. The Assessor’s Office is going to handle when and if a re-assessment, that could potentially impact property taxes, is required. The Assessor’s Office has a process to contest a property’s assessment including a free review. An independent appraiser can always be hired as an expert witness to contest the property’s assessment via a hearing.
Capital Gains Taxes
Whenever anyone profits from the sale of a home in California, they will probably owe some amount of capital gains tax (unless you qualify for an exclusion). Homelight.com describes capital gains as “the profits made when you sell an appreciable asset, such as a house. For example, if you buy a home for $200,000 and sell it for $500,000, then you have a capital gain of $300,000. In California, capital gains are taxed by both the state and federal governments.” Taxes range from 0% to 20% on the federal level and 1% to 13.3% on the state level. A lot goes into calculating these exact taxes, but on a $300,000 capital gains, one might expect to pay $45,000 in federal taxes and $22,500 in state taxes ($67,500 total). The $300,000 gain just became $232,500.
What is a Step-Up Basis?
What is a Step-Up Basis? As of the publication of this article, the IRS allows the basis of a real estate asset to be “stepped-up.” This means the basis for calculating the capital gains can be amended when a property is inherited. (https://www.irs.gov/faqs/interest-dividends-other-types-of-income/gifts-inheritances/gifts-inheritances). An appraisal of the property is typically done with an effective on the date of death which establishes a new tax basis.
What does this mean to me?
Let’s suppose you and your spouse purchased a property for $200,000 in 2000. You had a wonderful life in the home, and they passed away in 2018. It’s now 5 years later and time to move on and be closer to the rest of your family so you are selling your home for $750,000. Under normal circumstances, there would be $300,000 in capital gains ($550,000 profit, less a $250,000 exemption) and you’d owe $67,500 in state and federal taxes. However, you had your house appraised as of your spouse’s date of death in 2018 and it was worth $400,000. The basis has now been “stepped-up.” Now the new capital gains would be only $100,000 ($350,000 gain, less the $250,000 exemption). In this scenario you might only owe $22,500 in state and federal taxes, not $67,500. In this example getting an appraisal saved $45,000 in taxes!
This not only applies to spouses, but all estate and trust beneficiaries. It’s always best to discuss your individual scenario with your tax professional to make the overall best financial decision.
The Bottom Line
This is a lot to digest, but in summary, having a property appraised when someone passes away can save capital gains taxes when the property is sold. Recently, I was hired to appraise a property even though the owner passed away 28 years ago. This is a much more complex assignment, but not impossible. The heir of the property was selling and just became aware they needed an appraisal.
If you have a loved one that passed away, I’m happy to discuss your scenario to see if an appraisal makes sense. I regularly complete appraisals in Grass Valley, Nevada City, Auburn and throughout the Sierra Nevada Foothills for estate and trust valuation. The IRS has very specific guidelines on who can complete appraisals for step-up basis and the procedures must be followed. I have completed hundreds of appraisals for individuals, estates, and trusts over my 20 years appraising properties. I have taken courses specifically on preparing appraisals for IRS review and have extensively reviewed IRS and California Franchise Tax Board instructions. There is always risk of an audit when it comes to capital gains and taxes, but I am confident that appraisals I have prepared will not be questioned.
DISCLAIMER: All information presented in the Nevada County Appraisal Blog is meant for educational purposes only and is NOT intended for any other use. This information is not considered an appraisal and does not support any specific value opinion or eliminate the need for an appraisal for a specific property. Please give us a call at 530-632-3428 to order an appraisal for an accurate opinion of value for a specific property.
I'm now an SRA! ... and a brief market update

It’s been some time since my last blog post, I apologize for that, but I’ve been a little busy. I wanted to share some exciting news; I am now an SRA Designated member of the Appraisal Institute. Throughout my years of appraising, I’ve been involved with other appraiser associations, such as the Real Estate Appraisers Association, and the National Association of Appraisers, but wanted to further expand my education and enhance my experience and expertise appraising residential properties.
What I’ve Learned
In my opinion, learning never ends. I graduated with an economics degree in 2002. I took most of my appraisal training classes from 2003 through 2006. I had a wonderful education, but the older I get, the longer its been since I’ve been I’ve had advanced education. While all appraisers are required to take continuing education courses to keep their licenses active, not all education classes are created equal. Throughout the designation process I took upper education level courses on appraisal ethics, legal standards, appraisal report writing, market analysis, highest and best use, real estate finance, statistics, and valuation modeling. Each course required a proctored final exam testing my knowledge. The SRA process also required experience logs where another designated appraiser reviewed and critiqued appraisals I previously completed. I passed a demonstration report that was the most detailed appraisal I’ve ever written. Lastly, I passed a proctored cumulative exam testing my overall knowledge of all appraisal procedures and practices. Throughout the process I learned new communication skills, techniques, and technologies to better my communication with clients.
What This Means to You
Not all appraisals are the same, and not all appraisers have the same education and experience. The Sierra Nevada Foothills are a very complex market and hiring an expert in the market is a key component in the valuation process. Many real estate professionals can give credible results, and that is very important, but communication of findings cannot be overlooked. For example, litigation cases have been decided because communication and accuracy of procedures were correct in one report while the other report had numerous errors. Hiring a professional with experience and abilities to communicate can make the difference in many scenarios. The IRS can choose to audit an entire estate file because an appraiser didn’t make specific disclosures in a report. A judge or mediator can issue a decision because the correct definition of market value was not accurately communicated. Hiring a professional with an advanced skillset can eliminate unforeseen and unwanted outcomes. There are currently 80 appraisers with active licenses in Nevada County, according to the State of California Bureau of Real Estate Appraisers. I am now one of two appraisers in Nevada County with the SRA designation. In the entire state of California, only 1.6% of appraisers have an SRA designation.
The Appraisal Institute offers several different types of designations. These designations are typically specific to an appraiser’s expertise. The SRA designation is for professionals who provide a wide range of services for residential properties. Although a designated appraiser may not be necessary for every type of appraisal needed, when one is hired, the appraisal and appraiser is known as a top professional in the field.

What’s Going on in the Market?
Mortgage interest rates are in excess of 7% and are driving current market conditions. It may not make any financial sense for owners to sell their property if they currently have a 3% mortgage. This is driving the supply of properties available. The number of sales has been down during the summer of 2023, by approximately 25%. The current inventory of available properties for sale (based on the number of closed sales) has fluctuated between 2.1 and 3.5 months. In August 2023 there were 2.7 months of listings available for purchase.

The price trend for single family residential homes depends on the specific market. Overall, median prices were slightly down in August 2023 from July 2023 and were down 4% from August 2023. But a closer look at specific price trends can tell a slightly different story.
This week I appraised a townhouse in Grass Valley. Analyzing the data for condominiums and townhouses in Grass Valley and Nevada City showed an overall stable price trend. The data indicated a slight appreciation in values of 5.6% over the past two years


I also appraised a property in South County on approximately five acres. This is a much different market segment that appeals to different buyers. For this segment I searched properties located in the South County and McCourtney MLS areas, with homes between 1,600 and 3,500 square feet, located on 2 to 10 acre parcels. This analysis showed a decline in price trends of approximately 14% over the past two years.
Conclusions
Overall, the market in Nevada County is fairly stable. Although there are few homes on the market, the supply of available homes is keeping up with demand. Median prices for the county have declined slightly from 2022, but remain mostly stable. But this story doesn’t always tell the entire picture. Every home and every market segment is unique. Each market segment must be analyzed to determine an accurate trend. As always, I recommend hiring a real estate professional for your specific needs to determine trends for your home.

Happy Thanksgiving ... with a side of Market Trends

I want to wish everyone a Happy Thanksgiving and a wonderful end to 2021. I am very thankful 2021 has kept me so busy this year completing appraisals in Nevada County!
I recently received an email from Shelley Mortara at Nevada County Mortgage. She reached out inquiring about the current trends in Nevada County. I love how local lenders like Shelley and her team want to keep their fingers on the pulse to betters serve their clients. I did some analysis and wanted to share.
For each and every appraisal I complete, I start with completing two analyses to get a good indication of what the market is doing for properties that directly compete with the subject property. For the graphs below, I’ve analyzed all sales in Nevada County (data source Metrolist) to get an idea of how the market as a whole has performed.
Individual Sales Analysis
This is a graph of every sale in Nevada County from 2021. (In order to see the trends better, I've hidden the sales above $1.75M, but they are accounted for in the trend). The linear regression trendline (the straight red dotted line) indicates an increasing market at a rate of 10.2% over 2021 or 0.93% per month. A 3rd order polynomial trendline (the curved green dotted line) shows where the data indicates rapid rising and leveling off. As you might suspect the graph indicates the last couple of months leveling off from the rapid appreciation we were experiencing in the spring and summer months.

Median Sales and Grouped Median Sales
Another way to look at the data is through monthly median sale prices. And because Nevada County doesn't have a whole lot of data points, I do a second analysis of 3 months grouped median sale price data. So the first point is the median sale price from Jan - March, the second is Feb - April, the third is March - June, and so on. Once all of these points are plotted (both median and grouped median) I add a linear regression trendline (the straight red dotted line). This data indicates an increasing market at a rate of 7.34% over the year and 0.67% per month. One thing to remember about analyzing median sales, they can be heavily influenced by a high sales volume in certain price ranges. So if over the summer we had a bunch of homes selling in the $1M+ price range and then in the fall, a lot fewer properties sell in that price range, a median sale price analysis is going to look like it's declining. Something to keep in mind when you see prices starting to drop after august in the graph below.

Market Value Below Purchase Price
Shelley asked, “We would like to have a pulse on the market. Do you have any information of appraisal market values indicating the purchase price or less than the purchase price?”
Your question regarding appraised values less than purchase prices is a really good question. I've never actually measured it before. I can tell you offhand, prior to the last couple of years, it rarely happened. Off the top of my head, it happens less than 5 times a year and typically only once or twice. And this should make sense; in a normal market, if a home sells on the open market, with knowledgeable buyers and sellers, there is a high likelihood the home is going to sell at or near its market value. Rapidly increasing markets create a huge challenge where the data and closed sales can lag a little behind how quickly prices are rising. Even if appraisers correctly measure the market and account for appreciation, the market may be going up faster for that specific home. Nevada County has also seen buyers coming in from other areas where they may have capitalized on equity and are seeking a lower-priced market. In that case, they see Nevada County (even with rapidly rising prices) as a "steal." Being flush with cash, they may be willing to pay higher than market value, because they just capitalized on record prices elsewhere. So far in 2021, I have appraised 81 purchases, 10 of which the market value indication was less than the purchase price. Many of these were for land sales. That equates to a little more than 12% of my purchase appraisals. Most of these were from Jan - June when prices were rising the most.
Conclusion
Market values have continued to rise during 2021. Most of this appreciation happened at the beginning of the year. Values have started to plateau in the last couple of months, but this is typical this time of year. There are fewer homes for sale and fewer buyers seeking homes during the winter months.
Enjoy the 2021 holidays and I plan on having a very thorough market analysis recapping 2021 in January. Happy Holidays!
DISCLAIMER: All information presented in the Nevada County Appraisal Blog is meant for educational purposes only and is NOT intended for any other use. This information is not considered an appraisal and does not support any specific value opinion or eliminate the need for an appraisal for a specific property. Please give us a call at 530-632-3428 to order an appraisal for an accurate opinion of value for a specific property.
Nevada County Market Update

The real estate market in 2021 has been a wild one! If you've been seeing “For Sale” signs in your neighborhood, they probably don’t last long. Overall, the median combined days on market (CDOM) for all residential sales in Jan - July in 2021 was 12 days. Over 67% of sales were on the market for less than a month. If you have been in the market for a home, you know just how fast homes are selling.
What about Prices?

Overall, median prices have continued to rise. This has been the trend of the past couple of years. Nevada County hasn’t seen a decline in median prices in almost a decade.

Median prices fluctuate from month to month, but an analysis of the last two years of median prices for residential properties in Nevada County shows a 2% per month increase in prices. Historically, this is a high rate of change. Over the past 3 months, prices have slowed down slightly, increasing at a rate of “only” 1.5%.
July 2020 vs July 2021
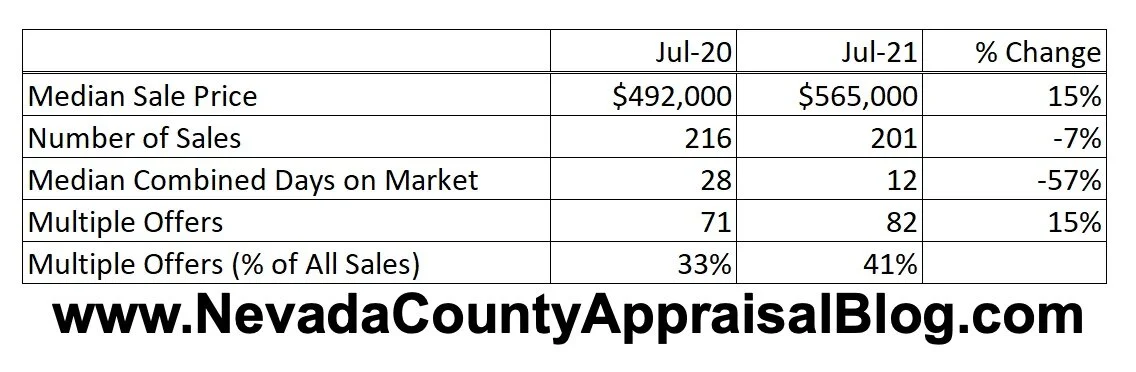
Comparing statistics from July 2020 to July 2021 shows price trends are similar, with the median price increasing 15%. While the number of sales was about the same, the amount of time a home was listed on the market (CDOM) was down 57%. The market was also very competitive. Multiple offers were very common with 41% having more than one offer. The amount of multiple offer sales increased 15% when compared with July 2020. Two sales in 2021 had 14 offers, per MetroList MLS. They sold for 12% and 13% over the list price and sold in 8 days or less. Local real estate agents are working hard for their clients!
May 2021 - July 2021

Over the past three months, median prices have continued to rise, but not quite as quickly as in previous months. This is pretty typical for this time of the year. The number of sales continues to rise, and marketing times are slightly up. Multiple-offer scenarios are slightly down, but still very common in this market.
Appraisals

Freddie Mac put out this graph last month and it shows just how busy life is for appraisers. The amount of appraisers in the industry who regularly complete appraisals for lender work has remained fairly consistent since 2014. Loan volume for purchase appraisers is consistently cyclical but has slowly increased since 2013. The loan volume for refinancing appraisals has absolutely skyrocketed. This is directly correlated to low mortgage interest rates. Fixed-rate 30-year mortgage rates are approximately 2.95% right now. Most appraisers I talk to are booked out for 4-5 weeks with appraisal orders.
Final Thoughts
Average and median prices continue to rise for the entire market of western Nevada County. Each sub-market is different, so it’s always best to consult your local real estate professional for an analysis applicable to a specific property. The supply of homes on the market continues to be drastically low, with homes selling very quickly. Multiple-offer scenarios are extremely common in this competitive market. Statistics have slightly slowed in the past three months which is common for this time of year. I’ll be closely monitoring these metrics to determine if there is a change in market condition.

I was on my way to an appraisal inspection in Nevada County when the River Fire broke out along the Bear River. Immediately after seeing the smoke plume, I called the homeowner only to find out the Nevada County Sheriff had just come by notifying them of the evacuation orders. Thankfully, their home was not destroyed. That wasn’t the case for 102 homes with several additional structures damaged. The Nevada County Relief Fund continues to solicit donations for the River Fire Relief Fund. Click Here to Donate.
Nevada County 2020 Real Estate Recap

Almost every recent conversation I’ve had about real estate has begun with “How nuts is this market?!” Whether you have been too consumed with the events of 2020 to pay much attention to real estate prices, or you are consistently glued to your preferred listing site, you might be aware that this past year in real estate has been… different. Here’s a recap of the very active market we have experienced since early 2020.

This data comes from MetrolistMLS which typically only covers Western Nevada County. The number of residential properties sold increased by almost 15% in 2020, compared with 2019. The total value of those sales increased by 28%. Median and average prices rose by over 10%, so generally speaking, the market increased in 2020. Furthermore, a greater number of higher-priced homes sold in 2020 than in 2019. In my appraisal experience in Grass Valley and Nevada City, this is likely due to people moving from urban centers like the Bay Area (more about this later). Interest rates, dipping below 2%, also factored into increased sales. My friend Ryan Lundquist who authors the Sacramento Appraiser Blog, stated that low-interest rates like the ones we have been experiencing are like rocket fuel for the real estate market. This could be why, although the number of total sales increased almost 15%, we had virtually the exact same number of all-cash sales. Bank-owned sales and short sales continue to represent a very small portion of the market. As expected, the time it takes to sell a home has considerably decreased.
The good ol’ days

Back before we all traveled around with hand sanitizer and masks over our faces, life was pretty normal, and so was the real estate market. Early 2020 had pretty similar prices compared to the past three years and the number of sales was even slightly down. This time of year is always the slowest for the real estate market.
Lockdown

Nevada County, along with the rest of California, was under Stay-At-Home orders during March and April. While there was some real estate activity, many of these transactions were in contract pre-lockdown. In a time of year when real estate in Nevada County typically starts to pick up, 2020 brought a decrease of 17% in home sales
Recovery and BOOM

By mid-May, the state of California issued guidance on Real Estate transactions. The world at large was beginning to function in the new normal of pandemic life. Real estate in Nevada County began to take off in a way we really haven’t seen before. The number of sales increased 31%. Average and median prices were up 13% and 16 %. The value of all sales was up 52%. All of this happened without an increase in homes hitting the market. In 2019, from 5/15-12/31, there were 1,318 new listings that hit the market. During that same time period, there were 1021 closed sales. This means approximately 77% of homes listed on the market were selling. This was a pretty normal activity. In 2020, from 5/15 - 12/31, there were 1365 new listings that hit the market, an increase of 4% from the year before. There were 1327 closed sales in 2020 during that time period, indicating 97% of homes listed, sold. There was a decrease in homes taken off the market (expired or withdrawn listings) of 44% in 2020 vs 2019 (5/15 - 12/31).
Prices and Demand
Average and median prices increased by 10-11% in 2020 and the average price-per-square-foot increased by 2.1%. But 2020 was not an ordinary year where the distribution of sales was typical throughout price ranges. Nevada County saw higher than normal activity at the higher end of price ranges.

The tail end in the price range above $800,000 shows a lot more activity than in years past. From my experience with buyers and sellers this year, this is due to an influx of buyers from the SF Bay Area, especially since so many can now work remotely. Buyers are capitalizing on their years of equity in higher-priced markets and buying higher-end homes in Nevada County.
This directly impacts the average and median sale price statistics. While average and median prices increased by 10-11% in 2020, the typical appreciation rate I typically see when doing appraisals in Grass Valley and Nevada City is 5-7%.
Conclusions

This is a graph where every sale in western Nevada County is plotted. The volume of sales (dots) and the sales above $750k really stand out after 5/15/2020. It’s key to understand this new market if if you are considering purchasing or selling your a home. There are implications for over-pricing your home if you are holding out for that bay area buyer. It’s also imperative for buyers to realize the market value of their home and weigh that when they consider their offer. My suggestion is always to listen to your real estate professional, whether that’s your Realtor or trusted appraiser. They can give key insight and cater to your individual needs.

A Crazy COVID Real Estate Summer

Archive note: This article reflects the information and market conditions available on its original publication date. Requirements and conditions may have changed. Confirm current guidance with the relevant authority before relying on the article for a present-day decision.
The summer of 2020 has brought its fair share of challenges. Travel has been restricted to several countries, many employees continue to work at home, Black Lives Matter protests and counter-protests fill the streets of many American cities, and even the Nevada County Fair was canceled. The real estate market has also been greatly affected, but in a way most real estate professionals have never seen.
Lack of Listings
The months of April, May, June, July, and August typically bring the largest amount of new homes listed for sale. In 2019, new listings in these four months represented over 57% of the yearly listings in the region. On average, there were 255 listings each month during these months. Fast forward to COVID 2020 and there has been hesitancy for sellers in the Nevada County market. Some would like to sell their home, but are uncomfortable with open houses and tours. Others have put plans on hold to see how employment and the economy recover. Many have decided they are content in their current situation and don’t need to move. Whatever the reason may be, the number of homes listed for sale is down over 25% in 2020 vs the April-August in 2019. This has created a HUGE shock to the housing supply.

Increasing Demand
Similar to new listings, the demand for homes (measured by the number pending sales) is typically highest April through August. Pending sales in these months represented 45% of all pending sales in 2019. So far in 2020, pending sales are up 20% over the pending sales in 2019. In June, July, and August of 2020 within the Nevada County Market, there were over 200 pending sales each of these months with 244 pending sales in July alone. In 2019 the busiest month had 165 pending sales. The Nevada County market is on pace to increase pending sales in 2020 by 21%. This is extremely uncommon considering the lack of listings.

Multiple Offers
With a shortage of inventory and higher-than-typical demand, the Nevada County Real Estate Market is currently very competitive. While it’s pretty typical for the summer months to be more competitive, 2020 has been an anomaly. Overall multiple offers on closed sales are up 7% in 2020 vs 2019. However, 36% of closed sales had multiple offers in 2020 which is 14% higher than in 2019. Prospective buyers should expect competition when submitting offers. All of these indicators point towards a ‘seller’s market.’

Prices
Evidence of price changes are typically the last indicator we can measure. In real time, prices change during negotiations for individual homes but can’t be proven or measured until after homes close. Furthermore, one sale does not prove prices in the whole market have changed. So even though we can see that inventory is decreasing, demand is increasing, multiple offers are becoming more common, there may not be evidence prices are higher. Since 2017, median sales prices per year have shown a slight increase. July and August 2020 show a dramatic increase of 13-28% over years past.

Specifically, since July 1, 2020, average closed sale prices started to become significantly higher compared to average sale prices in 2019.

Looking at every closed sale in Nevada County (in the Metrolist MLS system) there is a trend of increasing prices over the past two years. Linear regression, a mathematical way of measuring that increase, indicates the market has increased 0.5% per month over that time period.

If we are to focus in on just the last 6 months, the rate of increasing prices changes dramatically. From March 1 prices have increased almost 3.9% per month.

That rate of increase seems drastically different than the 2-year trend. Notice on the graph below how some dots deviate from the main cluster. The statistical term is “outliers.” Since July 1 there have been 28 sales over $1M. The highest sale, a 739-acre ranch in South County, just closed at $3.1M. (Check out the photos HERE). If we aren’t very careful in analyzing the data, outlier sales can throw off statistics and show different trends.

A more realistic approach is to analyze the trend where the bulk of sales occur. Over the last 6 months, between the price range of $225k - $900K, data shows the market has been increasing at a rate of 1.5% per month. This seems to be much more realistic and probably more representative of most markets within Nevada County.
Conclusions
Due to several reasons, there have been fewer homes on the market than in previous years. At the same time, demand for homes in Nevada County has increased. If we combine that with record low interest rates, it creates a frenzy where it’s more common to have increased competition when trying to purchase a home. As result, prices have increased and the higher-end markets have several recent sales.
Other Factors
I mentioned record low-interest rates. An appraiser colleague of mine said they were the ‘rocket fuel’ of the residential real estate market. Right now, 30-year fixed-rate mortgages are hovering just below 3% (2.91%) which gives buyers higher purchasing power.
The unemployment rate was 10.6% in July 2020, down from 15.2% in April. This is below the statewide unemployment rate of 13.7% in July.
AB 3088 was signed into law on Aug 31 protects all evictions from occurring until Feb 1, 2021
The overall forbearance rate, or pausing mortgage payment, is 7.2% which is a 4 month low.
DISCLAIMER: All information presented in the Nevada County Appraisal Blog is meant for educational purposes only and is NOT intended for any other use. This information is not considered an appraisal and does not support any specific value opinion or eliminate the need for an appraisal for a specific property. Please give us a call at 530-632-3428 to order an appraisal for an accurate opinion of value for a specific property.

Update to the Nevada County Market and the impact of COVID

Archive note: This article reflects the information and market conditions available on its original publication date. Requirements and conditions may have changed. Confirm current guidance with the relevant authority before relying on the article for a present-day decision.
In my last blog post (early May 20200,) we had begun to see pretty significant impacts on the Nevada County residential real estate market. New listings were down, pending sales were down, properties taken off the market were way up, and closed sales were slightly down.
We’ve had a few months of similar trends and I have some observations. First, let’s review some fresh statistics. I’ve concentrated on comparing 2020 vs 2019 to isolate the impact of a COVID 2020 market and comparing that to a normal 2019. From Jan 1 - March 19 (CA’s stay-at-home order begin date), 2020 was out to be a similar year to 2019, maybe even have a larger amount of sales. From March 20 to July 1 has been a completely different story.
New Listings
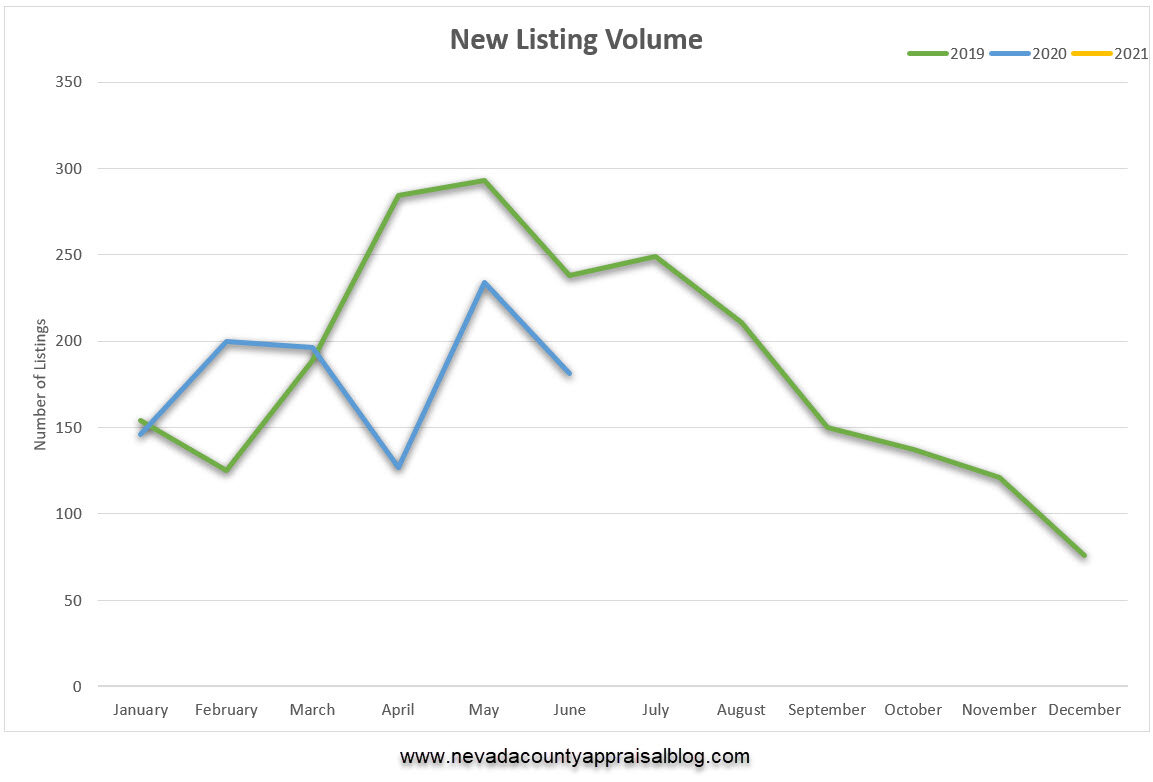
New listings are still down. The state of CA issued industry guidance for Real Estate Transactions in early May which has helped real estate professionals understand how to navigate buying and selling homes during a pandemic. These have helped both buyers and sellers understand what to expect when viewing a property. Masks, gloves, shoe coverings, and hand sanitizer is mandatory in almost all homes that are occupied by sellers. Still, new listings are down 35% in 2020 (from March 20 - July 1) vs 2019. I believe this is two-fold, there are some sellers who have decided they don’t want to sell in such uncertain times. There is also a group of sellers who still want to put their home on the market but are not comfortable with potential buyers entering their home. I’ve been calling this a potential phantom inventory of new listings that could eventually hit the market.
Pending Sales
At the beginning of the pandemic, pending sales were down 48% (March 16-31) but have since rebounded in a big way. Overall pending sales are actually up 16% from March 20 to July 1 in 2020 vs 2019. The average listing prices of those pending sales are slightly up (+6%). This shows that buyers are still wanting to buy homes. In fact, from June 16 - June 30 2020 there were 129 pending sales in Nevada County, an increase of 122% over the same period in 2019. It’s common for a home to sell very quickly if its priced correctly. Most of the appraisals I have completed in Nevada County the past few weeks show a drastic inventory shortage in many markets.

Listings Taken Off Market
Just like pending sales, we saw a dramatic impact on listings taken off the market at the beginning of the pandemic. From March 16-31 there was an increase of 228% in homes taken off the market (2020 vs 2019). This trend did not continue. Overall from March 20 - July 1 listings taken off the market are slightly up (+7%) in 2020 when compared to 2019.

Closed Sales
Because the purchase of a home involves an escrow time period, the data for closed sales typically lags a little but gives good insight as to what transactions actually complete. At the beginning of the pandemic, some properties in escrow fell out because buyers didn’t want to complete a purchase during such uncertain times. An escrow of a home I was appraising was delayed because the buyers home they were selling, out of the area, fell out of escrow. While this is a normal scenario, any delays will impact the sales that can close. From March 20 - July 1 closed sales are down 14% in 2020 vs 2019. With the number of pending sales from June 16 - June 30, I’d expect that to change.

Prices
Overall, closed sale prices are a good indicator of price trends. Right now, the data indicates prices are overall stable. The average sale price for all sales March 20 - July 1 was $478,667 in 2020 (All residential sales in Nevada County per Metrolist MLS). This is slightly up (+2%) from the same time period in 2019. The average price per square foot was $247.57, which is slightly down (-1%) from 2019. Some buyers are expecting to get a COVID pandemic discount, and it’s just not there. I have noticed, due to the lack of inventory, that buyer’s offers are often higher than the market can support. Because of the lack of inventory, potential buyers feel the need to make a full-price offer or an offer above listing price within the first few days a home is on the market. If this price is higher than what can be supported, this can cause major issues with closing escrow, especially if the buyer is relying on financing to close that escrow. It’s always best to consult your real estate professional when deciding on your offer. If that offer cannot be supported, be prepared for the lender to require more funds out of pocket in order to complete the deal.


Marketing Times
The average combined days on market (CDOM) is the way real estate professionals measure how long it takes to sell a home. In 2019 the average monthly CDOM ranged from 49 to 89 days. 2020 has been much of the same with monthly averages ranging from 51 to 92 days. It’s important that sellers keep this in mind when their home is newly listed, but didn’t sell in the first 10 days. We all hear stories on social media that people are selling their homes in one weekend, and that does happen, but the reality is that 2-3 months of marketing time is typical. And when the price range goes up, typically so do the marketing times.

Other Economic Factors
The unemployment rate in Nevada County was 14.2% according to the preliminary numbers for May 2020 (CA Dept of EDD). That’s 4,190 more people on unemployment in 2020 than there were in 2019. This is massive and many are thought to be temporary, and with the economy re-opening and individuals returning to work, it’ll be imperative to determine how many temporary unemployment situations become permanent. It’s not just retail, bars, and restaurants that may be subject to a trickle-down effect. There will be many support industries (such as sales forces, marketing, advertising, tech support, and manufacturing) who will not feel the impact of a recession until months later.

Since early April, the Judicial Council of California voted to halt evictions and foreclosure filing for 90 days. This has been extended and there is the legislature in progress (AB 1436) that would bar landlords from evicting tenants for up to 90 days after the state of emergency is lifted. We may see a dramatic rise in evictions and foreclosures once they are legally allowed. Mortgage forbearance, or pausing your mortgage payments, has slightly decreased but according to the Mortgage Bankers Association 4.2 million homeowners currently have mortgages in forbearance plans (as of 6/28/2020).
The average U.S. rate for a 30-year fixed mortgage rate last week was 3.13% which is the lowest on record per Freddie Mac. Lower mortgage rates typically help support stable and increasing home prices because the cheaper the mortgage rate, the more borrowers get with keeping the same monthly payment.
Final Thoughts
Right now, the Nevada County real estate market is playing catch up for the March and April lost months. This is true for many parts of the country. Locally, we are seeing fewer sellers list their homes, which is creating a shortage. It’s unknown if this shortage will continue with many businesses and industries ‘opening back up’ and attempt to return to normal. Prices continue to remain overall stable. Sorry, buyers, there is no massive pandemic discount. And sellers, although there is a shortage, we haven’t seen prices increase yet. Marketing times remain very similar to what they were pre-pandemic. There are so many other factors going on in our economy this is always subject to change. As I’ve said many times before, my crystal ball is broken, so I’m not going to predict what’s going to happen in the future. Of course, I will be here to analyze the data and pass my analysis along.
I wish everyone a happy, safe 4th of July!

Impacts of Coronavirus on the Nevada County Market

Archive note: This article reflects the information and market conditions available on its original publication date. Requirements and conditions may have changed. Confirm current guidance with the relevant authority before relying on the article for a present-day decision.
It’s been almost two months since a National Emergency was declared because of the Coronavirus pandemic and the effects are being seen nationwide. Most Americans have been under some sort of stay-at-home guideline for 6+ weeks and weekly unemployment numbers continue to be the worst we’ve seen since the Great Depression.
Real estate markets can be extremely difficult to track. For the Nevada County market I typically track monthly statistics, concentrating on volume, prices, marketing times, and supply-and-demand. Shortly into the pandemic, I began to realize change was happening on a daily, if not hourly basis, and I was going to need to rethink my analysis. I settled on focusing on a few factors on a bi-monthly basis; from the first to the fifteenth of the month and from the fifteenth of the month to the end of the month. I also realized because the market in Nevada County changes so drastically throughout the seasons, it would be best to analyze the current time period within years past. Let’s take a look at a few different categories and how Coronavirus has impacted 2020.
New Listings


New listings have decreased dramatically. A National Emergency was declared on March 13 and the California stay-at-home order was issued on March 19. Sellers began to be impacted immediately as new listings went down down 54% from March 16 - April 30 comparing 2020 to 2019. Prices of these new listings have stayed stable throughout the pandemic and are slightly up (2.1) vs 2019. Would you list your home during a pandemic?
Pending Sales


Pending sales also saw a dramatic decline at the beginning of the pandemic. From March 16 - April 15, pending sales were drastically lower than the same time periods in 2019. From April 16-30, buyers appear to have gotten a little more comfortable making offers during the pandemic. Overall, from March 16 - April 30, pending sales were down 31%. Prices of these pending sales appear to be slightly lower (-5%) than prices in 2019. Would you purchase a home during a pandemic?
Listings Taken Off Market


Listings that were taken off the market immediately spiked from March 16 - 31 and were up 228% vs 2019. Gradually there have been fewer new listings and fewer listings taken off the market. From March 16 - April 30, listings taken off the market were up 57% vs what they were in 2019.
Closed Sales


New listings are down, pending sales are down, listings taken off the market are up … we are starting to see a trend. Closed sales were actually up at the beginning of the pandemic. This could be a sign that Nevada County was on schedule to have a much larger volume in 2020 or it could have been a rush to close as many sales before the pandemic started to affect things. The volume of quickly closed sales dramatically decreased. From March 16-April 30 closed sales were down 15% vs 2019. Prices continue to be strong with the average sale price up 6.8% in 2020 vs 2019.
Conclusions
Comparing the current pandemic period (March 16 - April 30) vs 2019, new listings are down 54%, pending sales are down 31%, listings taken off the market are up 57%, and closed sales are down 15%. The pandemic is having a major effect on real estate in Nevada County. Prices really haven’t been affected … yet. Prices are a reflection of supply and demand. The supply of houses available are down, but so is demand. Prices will only be affected if the supply dramatically increases over demand.
Other Thoughts
Mortgage Forbearance is when a mortgage servicer allows you to suspend your mortgage payment for a limited period of time. The overall share of home loans in forbearance rose to 7.54% in the last week of April according to this Housing Wire article.
Unemployment continues to rise. In Nevada County, unemployment rose to 4.6% in March. I’d expect April to be dramatically higher.

The front page of the NY Times on Sat May 9th says it all. It compared the change in jobs since the end of World War II.


Appraising During Coronavirus

Archive note: This article reflects the information and market conditions available on its original publication date. Requirements and conditions may have changed. Confirm current guidance with the relevant authority before relying on the article for a present-day decision.
First and foremost, I hope this finds everyone safe and in good health. The coronavirus pandemic has affected the whole world in a way that is unprecedented. The repercussions have carried over to the real estate market and have affected how appraisers run their business. While real estate appraisers are considered an ‘essential’ business, I made the decision a few weeks ago to suspend all interior inspections of occupied homes. This was to protect my own health as well as to protect the health of occupants. At the time I made this decision, I was as busy as I had ever been. When I looked at my past inspections on the calendar, I realized I had been in 25 different homes, including clients, friends, family members, etc., in 14 days. The health risks were too great to continue that path. Since then, I have practiced social distancing and have found other ways to continue to appraise properties.
Appraising Has Changed
On March 23, 2020 the Federal Housing Finance Agency (FHFA), the governing body that oversees Government Sponsored Enterprises (GSE’s) Fannie Mae and Freddie Mac, announced they were granting flexibility for appraisal standards. Other government agencies, such as the Federal Housing Agency (FHA), U.S. Department of Agriculture (USDA) Rural Development, and the Veterans Administration (VA) also announced separate valuation practices.
These agencies have directed that desktop and exterior-only appraisals can be completed for lending assignments. Every agency has slightly different guidelines and lenders can always require a different scope of work. In my opinion, this is the right thing to do during this temporary state of national emergency.
Personally, I have created a questionnaire I email out to homeowners so they can provide details about interior materials and upgrades. If they are able, owners can also provide interior photos for use in the report, further enhancing an exterior-only appraisal. Desktop appraisals are typically reserved for purchase transactions where current MLS photos are available online and there is little question about the features and size of the home. Homeowners / clients should be rest assured every appraiser is always held to the standard there is enough data to make the appraisal reliable.
I have also used Zoom and FaceTime to conduct virtual interior inspections of properties. These are actually pretty fun and the homeowner can take me directly to any areas or features that I may have questions about.
Some appraisers are still out there inspecting the interiors of homes, but every appraiser I have spoken with is taking great precautions. They are continually asking if any occupants have a fever or are not feeling well before entering homes. While inside, most are wearing disposable shoe covers, disposable gloves, and masks. Every appraiser has always carried hand sanitizer in their car for after those ‘nasty’ houses, but now hand sanitizer is a must before and after every house.
What about the Market?
The extremely difficult part of any emergency is trying to determine its effect on the market. During the Camp Fire in Paradise, about 95% of the structures in town were destroyed. This was a huge and immediate decrease in market supply because everything had been destroyed. It also had a significant impact on market demand because so many occupants were left needing new housing. Before any homes were even listed or sold, we had a pretty good idea of what the market impacts would be.
The coronavirus pandemic will have a similar immediate effect, but at this time, the extent of its effect is unknown. Just like in Paradise, the market for homes changed before there was data to show it. The impact of closed sales won’t really be known for months, that is, until a home is listed and sold “Post COVID-19'.” It is imperative for every real estate professional to keep a keen eye on market indicators. Are buyers backing out of contracts? Are listings getting canceled or placed on hold? Are open houses getting canceled? While some of these may be temporary, all real estate professionals need to be in constant communication to discuss the current attitude of current buyers and sellers.
Employment
Back in October and November of 2018, I wrote a series of blogs on Predicting the Future (Part 1 and Part 2). One of the major conclusions was that unemployment can drastically influence the supply and demand of the housing market.

During the Great Recession in 2007-2013, when unemployment rose, the percentage of distressed sales (foreclosures and short sales) rose at the same time. When I wrote that article, the unemployment rate in Nevada County was near an all-time low of 3.4%. According to the California Employment Development Department (EDD), the unemployment rate in Nevada County was 3.9% in February 2020. Initial claims for Nevada County have not yet been released by EDD but show the number of claims statewide has dramatically increased in March 2020.


Unemployment claims have skyrocketed in the past couple of weeks and most forecasters think this is just the beginning. We won’t have the local Nevada County numbers for some time but I’ve known quite a few people who have already been furloughed or laid off.

A New York Times article from 4/3/2020 estimated the jobless rate is around 13%, higher than any point since the Great Depression. Joblessness and unemployment rates are expected to further increase over the coming weeks.
Conclusions
We are living through an era like most of us have never seen before. Ideally, this is all temporary and once stay-at-home orders are lifted, everyone goes back to work and our economy picks up right where it left off. The doomsday scenario is this is the beginning of a new depression where it may take decades for the economy to recover. In all likelihood, its probably going to be somewhere in the middle, but where in middle, we really have no idea. I’ll be keeping track of as many trends as I can and will be sure to update all of you. Stay safe.

Cash Is King

You’ve heard it a thousand times- “cash is king!” It’s thought that a former CEO of Volvo first used the expression while describing companies during the stock market crash of 1987. Companies with plenty of cash reserves could handle the changing market better than those that had poor cash management.
In today’s world, I interpret it to mean cash will get you a little bit more than paying with an alternative source of payment. At a convenience store, you may not have to pay the 50 cent credit card transaction fee. When buying a car with cash, you won’t pay extra for interest incurred during the life of a loan. When it comes to real estate, a cash buyer is what most sellers dream of. In an all-cash transaction, many financing hurdles are non-existent. If all offers are close to each other, a seller may choose a cash offer just for the simplicity of the transaction. In some cases, a seller may be willing to take less for an all-cash offer. An appraisal isn’t required in cash transactions, as there is no lender requiring one to determine the worth of the asset. However, I can’t stress enough the importance of the buyer obtaining an appraisal even in cash transactions (feel free to call me 530-632-3428). Many times, cash buyers are from out of the area and are flush with cash from their sale of a 1-bedroom condo in San Jose for $2.2 million, for example. These out-of-the-area buyers with cash should still know the market value of the asset they are buying. Furthermore, all real estate agents are typically held legally responsible for their fiduciary duties to act in the best interest of their client.

There are many financing options when purchasing a home. In 2019, 58% of homes were purchased with conventional financing. Typically, a conventional loan is a type of mortgage that is not insured or guaranteed by a government agency such as FHA or VA. FHA and VA loans accounted for 13% of loans in Nevada County in 2019.
There were 359 all-cash residential sales in 2019 in Nevada County accounting for 23% of sales volume. Cash transactions totaled over $177 million for residential real estate in 2019.

Compared to the Sacramento Region, Nevada County had a significantly higher amount of cash transactions. This may be due to a variety of reasons including slightly lower overall prices or future retirees relocating to get the highest bang for their buck. There was also a much higher amount of FHA transactions in the Sacramento Region.

Cash transactions have really grown over the past 19 years in Nevada County. Between 2001-2007, cash represented less than 20% of all transactions and conventional financing was at its height over 69%. Lending was much different back then and a conventional loan was basically given to anyone with a heartbeat.

Things were much different from 2010 - 2014. Probably due to low values, cash transactions made up over 30% of the market. Today things are right in the middle. Between 2015-2018, cash represented 26-28% and last year, cash transactions fell to 23%.

As the median home prices rise and fall, so does the percentage of conventional financing. Cash transactions peaked about the same time prices hit rock bottom. As prices have recovered, cash transactions have slowly started to decline.
Lots and Land

Undeveloped land sales are a little different. From 2001 - 2008, it was fairly easy to get a loan from a bank on undeveloped land. Cash was still the major player representing 38-60% of sales during those peak years. In 2005-2006, more undeveloped land sales had bank financing than were cash sales. ‘Other’ financing can be a variety of different sources such as a friend or relative. In 2004-2007 there were many hard money lenders that had a large impact on the undeveloped land market.

In 2007, the median price of undeveloped land started to plummet and so did lenders willingness to lend money to buy it. Many land loans were the first to be foreclosed upon and lenders quickly realized loans on undeveloped land were a very risky investment. Between 2010-2018, loans on land represented 2-6% of all transactions. Cash has been king in the land transaction representing 55-69% of transactions since 2012.
Conclusions
It’s always best to be informed about what’s happening in the market. That’s one of the major reasons I write these articles. If you or your client are going to ask for owner financing on a property, know that those types of transactions only represented 2% of all sales in Nevada County in 2019. Don’t even think about it in the Sacramento region. Are you or your buyers looking for land? Maybe owner financing is available, as 18% of the sales in Nevada County did some sort of owner financing in 2019. Cash always represents a big chunk of the market for both residential and undeveloped land in Nevada County. It will never fully go away, but when lenders are willing to lend their money, the real estate market is ready with their hands out. If you or your clients know you are competing with an all-cash offer, know that’s probably going to carry some weight with the seller.
DISCLAIMER: All information presented in the Nevada County Appraisal Blog is meant for educational purposes only and is NOT intended for any other use. This information is not considered an appraisal and does not support any specific value opinion or eliminate the need for an appraisal for a specific property. Please give us a call at 530-632-3428 to order an appraisal for an accurate opinion of value for a specific property.

January 2020 Market Update

I hope everyone had happy holidays and is ready for a new year and a new decade. It’s been a while since my last blog post and so much has happened. October brought us power shutoffs, November bought us snow, and December (hopefully) bought you warming spirits and time with family and friends. The October PG&E Public Safety Power Shutoffs (PSPS) significantly impacted almost all businesses in western Nevada County. My office had 6 power shutoffs over a 5-week span. Mortgage lenders require utilities to be operable during appraisal inspections, so my business drastically felt the impact of the power shutoffs. The question raised most often from family and friends during the holiday season was: “How are the power shutoffs, combined with the difficulty in getting fire insurance, impacting the local real estate market?” I thought it would be prudent to take an in-depth look at the market to see exactly whats going on.
One thing to keep in mind is that real estate markets rarely see an immediate impact to change. There are a few factors that can immediately impact the market, but typically it takes a long time for factors to change things long term. If unemployment jumps overnight to 10% (like it did in 2010), people lose the ability to pay their mortgage and before foreclosures hit the market, the sales volume decreases dramatically. When a wildfire rolls through a community destroying 90% of housing, the market is immediately impacted. On the other hand, most factors like approval of multiple new housing projects take a long time for their impact to be felt on inventory and prices. The power shutoffs were the center of everyone’s life in October, but even today, that feeling might have subsided (or blacked-out) a little.

Over the past decade Nevada County saw a steady increase in sales from 2010-2012 with a slight decrease in 2013-2014. The past 5 years have seen an overall stable trend for yearly sales with 2019 setting a high in sales at 1,539 which is 128.3 sales per month.

The yearly average and median price trend shows at the bottom of the market in 2011-2012 and a steady recovery from 2012-2018. The yearly average sale price increased between 4.5%-21.2% per year between 2012-2018. In 2019, the average sale price decreased by -0.5% from 2018. The yearly median sale price shows a similar trend increased between 4.1%-22.2% per year between 2012-2018. In 2019, the median sale price increased by 2.5% from 2018. This shows the market has stabilized.

Marketing times show a similar downward trend and have stabilized since 2017. In 2019, both average Days On Market (DOM) and Combined DOM slightly increased. The average DOM for 2019 was 58.2 days which is considered fast. Compare that with 2011 when the average DOM was 91% higher (111.0 days).

In 2019, monthly sales mostly mirrored the previous year, with the exception of October. As mentioned before, the power outages had a pretty significant affect on sales. November rebounded in a big way with 140 sales. Nevada County typically only sees that type of volume in the summer months of June and July.

A closer look at the 4th Quarter of 2018 vs 2019 and you can see that sales were down 15% in 2019. But sales bounced back in November, up 40% over 2018. Looking at the entire quarter, in 2019 the number of sales were up 7.8% and the average sale prices (0.5%) and DOM (4.3%) slightly increased over 2018.


Both the Average Monthly Sale Price and Median Monthly Sales Price graphs mirror each other for 2018 and 2019. The Average Monthly Sale Price graph shows a slight seasonality where slightly higher priced homes tend to sell during the summer months.

The Average DOM graph shows that seasonality even more drastically. In the summer months, homes sell faster than homes that sell during the winter.

I’ve been analyzing all homes for sale on the first day of the month and over the past six months and I’ve noticed an interesting trend. The overall number of listings has decreased as expected in the winter months. The average days on market of those listings has increased by 57%. Again this shows the seasonality affecting homes for sale. If you list your house for sale during the winter, expect it to sit on the market much longer than it would during the summer.
Conclusions
To summarize the 2020 January market update in one word: Stability. The Nevada County market has seen a very stable trend over the past two years. The market saw a rapid change from depreciation and the housing market crash bottoming out in 2011-2012 and a rapid recovery from 2012-2017. This data supports my daily appraisals in Grass Valley and Nevada City where I analyze the competitive market segment to each individual home. The past two years have been overall stable.
Individual Markets
Here’s a glimpse into each individual market in western Nevada County. Many areas have a very low volume of sales and trends can be inaccurate and misleading. For most individual markets, its best to concentrate on the trend throughout the county.

Grass Valley

Nevada City

Alta Sierra

Lake of the Pines

Lake Wildwood

Penn Valley

South County - McCourtney

Peardale - Chicago Park

Rough and Ready

Smartsville - Big Oak Valley

North San Juan

High Country - Washington
DISCLAIMER: All information presented in the Nevada County Appraisal Blog is meant for educational purposes only and is NOT intended for any other use. This information is not considered an appraisal and does not support any specific value opinion or eliminate the need for an appraisal for a specific property. Please give us a call at 530-632-3428 to order an appraisal for an accurate opinion of value for a specific property.

New Construction in Nevada County

Do you hear the sounds of nail guns and skill saws at 7:00 AM every morning? If it’s not your neighbor working on their birdhouse collection, it may a new home being built. With affordable housing in high demand, these construction noises might be welcome! Let’s take a look at some of the new housing projects in Nevada County.

Ridge Meadows is a subdivision located off Ridge Rd in Grass Valley. It consists of 37 homes from Homes by Town that were constructed in 2017-2018. Ridge Meadows sold out of their new inventory in late 2018. Their 3 plans range from 1,730 -2,118 sq ft with lot sizes ranging from 6,000 -13,000 sq ft. Prices in Ridge Meadows ranged from $435,000 - $560,000 with an average sales price of $479,618.


Timberwood Estates is a brand new community of 45 homes in the Brunswick Basin. Timberwood Estates is built by Hilbers Homes and offers 3 floor plans ranging from 1,804 - 2,224 sq ft. Lots are approx 6,000 - 12,000 sq ft. New homes are for sale right now in Timberwood Estates. Pricing was not available on the builder’s website (Link Here). For more information contact Hilbers New Home Communities 530-923-7863 or admin@hilbershomes.com.



Berriman Ranch is the second project from Homes By Town located in the City of Grass Valley. It’s located off McKnight Way behind the McKnight Crossing shopping center near the Pine Creek Center. The project consists of 30 single family homes with 4 floor plans. Homes range from 1,579 - 2,491 sq ft with base prices ranging from $440,500 - $488,500. Contact Ed Meadows, Lead Sales Consultant, for more information (916) 262-8800. (Website Link).


Pello Lane, Nevada City
Pello Lane is a planned project of 11 two-story homes within the city of Nevada City located off W Broad St. There are 4 total floor plans, of which, 1 home has been completed and is for sale. Four of the homes will have a granny unit. The home currently completed is 1,555 sq ft and is listed for sale at $490,000. For more information contact Tiffni Hald with Intero Real Estate at 530-277-9926.


Semi-Custom and Custom Homes
There are several semi-custom and custom brand new homes offered for sale throughout Nevada County. A 1,989 sq ft semi-custom home in South County on a 4.64-acre parcel is listed for $599,000. A 3,788 sq ft custom home in Darkhorse with a view of Lake of the Pines is for sale for $969,900. At the top of the new construction market, there is a custom home built by Kirk McGuire on Banner Mountain in Nevada City. The 3,248 sq ft home is located on 1.98 acres and is listed at $1,125,000. Contact your favorite Realtor to view one of these semi-custom or custom homes.


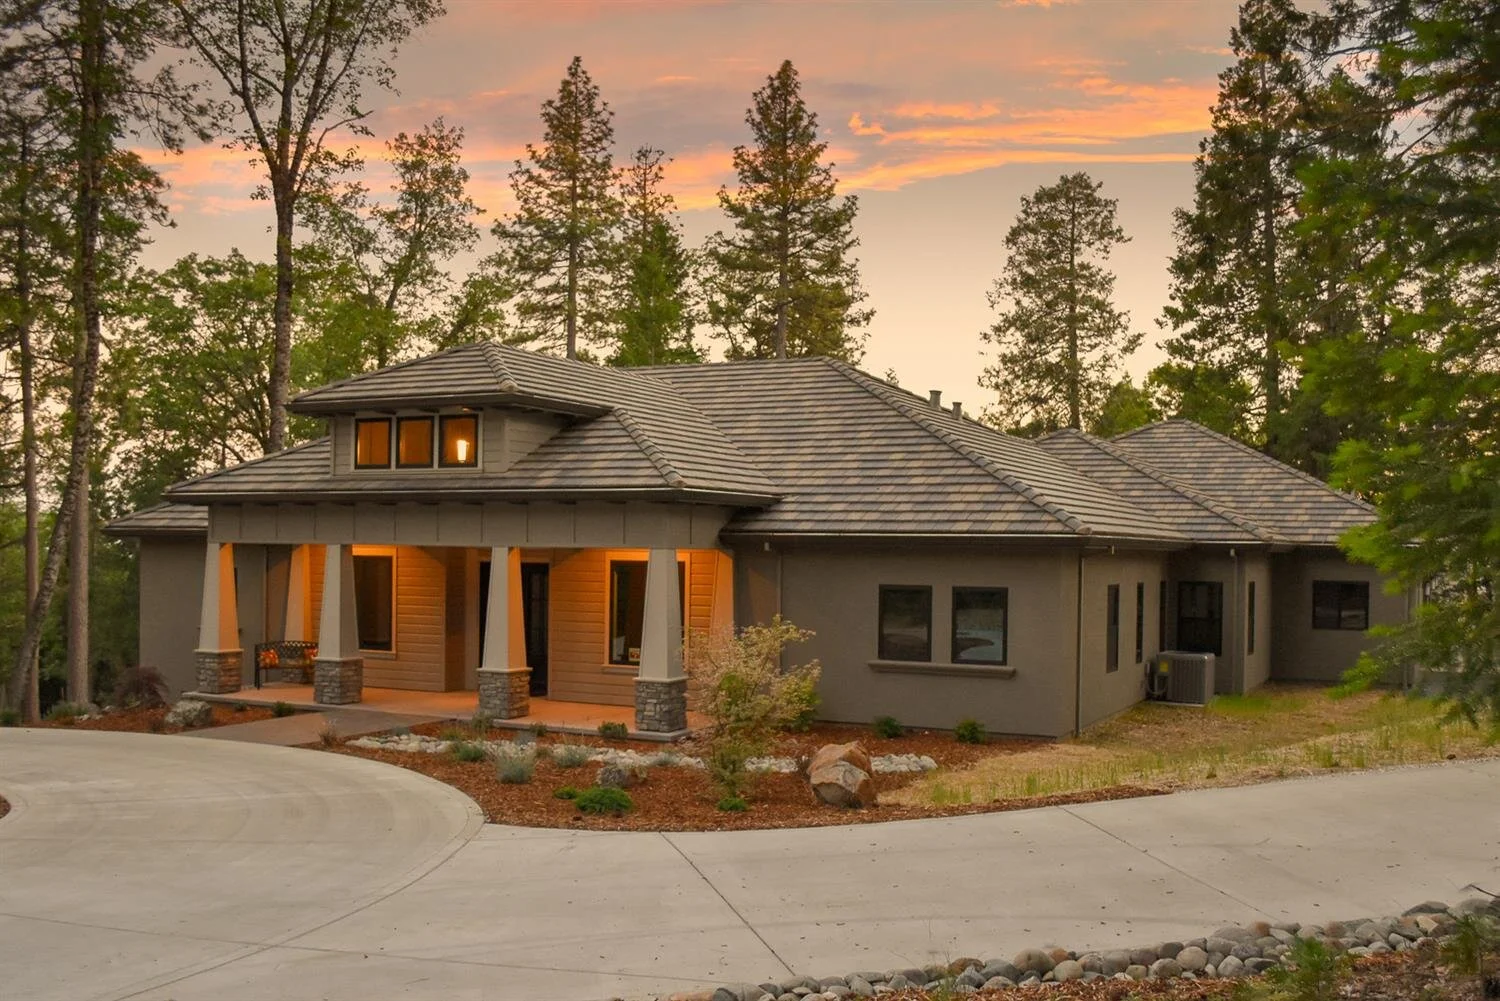
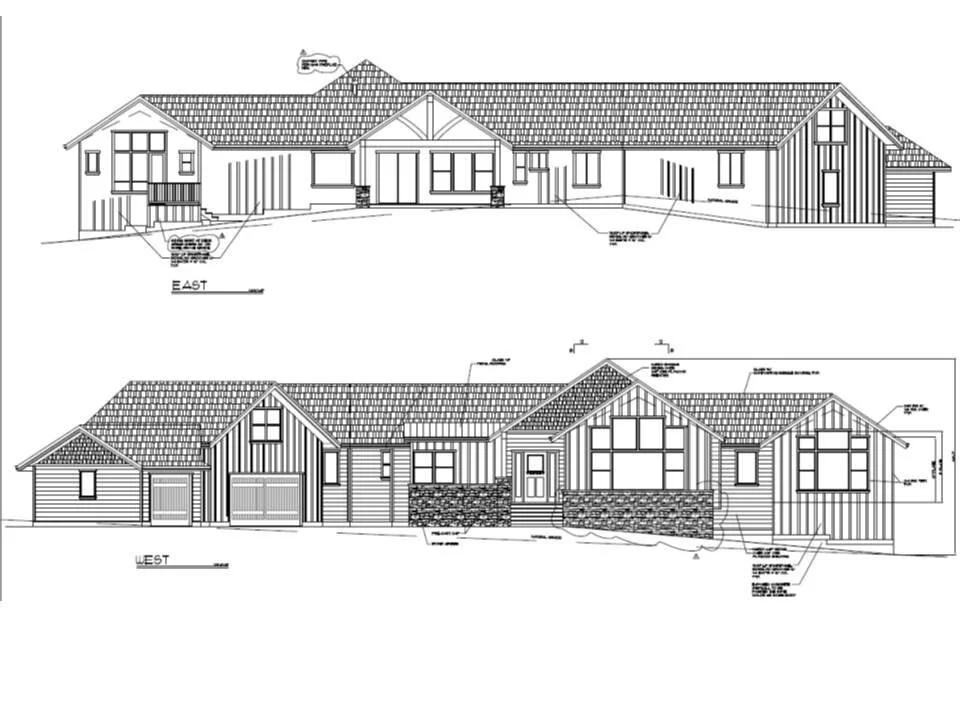

Loma Rica Ranch
Loma Rica Ranch is a 452-acre mixed-use, large-scale development in the Brunswick Basin. The Creeks neighborhood is the first phase, which will consist of 174 single-family homes and 60 duplex/townhouses. Lots range from 2,700 - 8,500 sq ft. Prices are estimated to start in the high $300,000’s for duplex/townhomes and go up to the high $500,000 for single-family homes. Three other neighborhoods slated for development are the Farm, Lake, and Trailhead.
Whiting Meadows
Whiting meadows is a planned community of 50 manufactured homes located of Whiting Way in Grass Valley near S Auburn St. This community features customizable 2-3 bedroom homes starting at $300,000.
Dorsey Marketplace
A planned shopping center on Dorsey Drive near Hwy 49/20 is slated to have apartment units. This may help with the much needed affordable housing in Nevada County.
Final Thoughts
When it comes to brand new homes, there is a little something for everyone. With manufactured homes in the lower-priced end of the market to custom homes at the upper end, there are new homes in every budget. However, the new construction market seems to focus on the middle to upper end of the market in Nevada County. A $600,000 brand-new home with 20% down would result in a monthly payment of over $3,000. The new construction market does little to directly impact any affordable housing crunch the area may have, however, there can be a trickle-down effect. A family living in a $500,000 may want that new $600,000 home and decide to upgrade. Another family living in a $400,000 home may decide to upgrade to that newly vacated $500,000 home. A family in a $300,000 home may decide to buy that $400,000. That’s when we could see the market for “affordable” housing open up. This is housing Reganomics. However, this relies heavily on stable prices and stable employment for a long period of time.
Questions? Comments? Did I miss a project? Feel free to leave your comments below and I’ll get back to you!

Sizzlin' Summer Market Update

Summer officially ends on September 23rd, but kids are back to school and the weather has just started to cool off. It’s been a super busy summer for appraisers in Nevada County. Low interest rates and lots of equity has kept myself and other local appraisers plenty busy this summer.
I’ve heard whispers from homeowners and Realtors that they think the market may be softening a little. Driving around, I see more and more for sale signs and open houses. I thought it would be a good idea to check the stats and see how the summer has played out compared to last year.
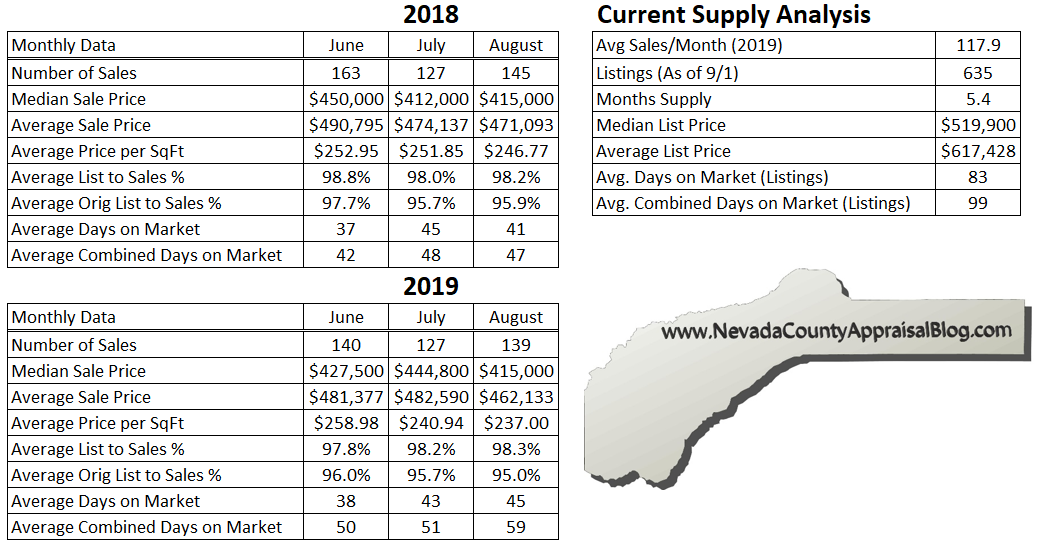
In terms of volume, sales were down 6% from last year during June-July-August. As of 9/1 there were 635 properties on the market in Nevada County, which is a 5.4 months supply based on the average monthly sales in 2019. This is considered a very balanced market. Marketing times are running slightly higher than last year.
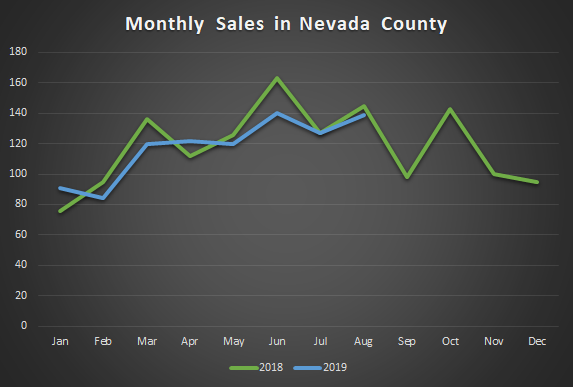
Although sales were down 6% for June-July-August, overall the monthly sales volume in 2019 are very similar to 2018. Year-to-date sales are down 3.8% from 2018. A slightly elevated supply and difficulty obtaining fire insurance has done little to affect sales volume. We can expect a drop in sales in September, which is typical for this time of year. I relate this directly to the beginning of the school year; parents rarely want to move a child right after a new year has begun. In 2018, sales picked right back up in October before slowing to close out the year.
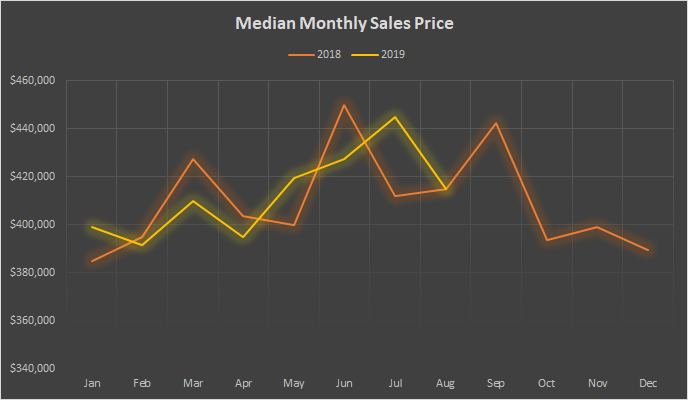
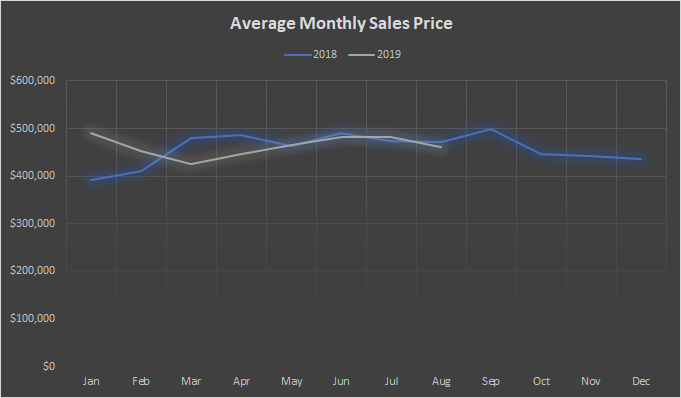
Average and median prices have remained stable in 2018 and 2019. While the market for each home can be vastly different, overall for Nevada County, the market is stable. If you purchased your home in the past couple of years, you shouldn’t expect any increase market appreciation.
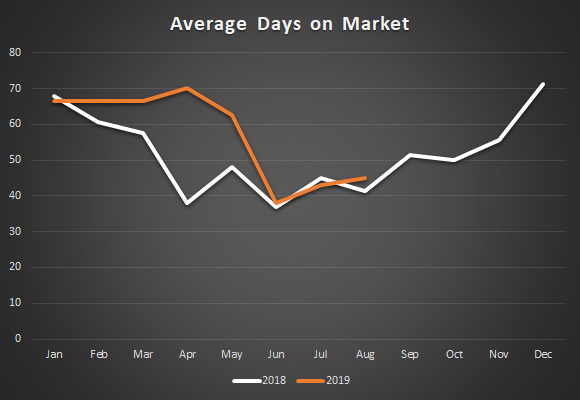
It took a little bit longer in 2019 but marketing times finally dropped to typical levels over the summer. This may have been due to our incredibly wet spring. We can expect to see marketing times trickle up moving forward.
Conclusions
Market prices continue to be stable. The average sale price in 2019 almost exactly mirrors 2018. The supply of homes on the market is larger than we have seen in 3-4 years but is still considered a balanced market. The current supply is 5.4 months, which is drastically lower to the 15+ months at the beginning of 2010. Marketing times (Days on Market) are slightly higher than 2018. If you have your home on the market, its going to take 2-3 months on average to sell, if the home is priced right. Is your home or listing priced right? Call today for a listing appraisal. (I had to throw that one in there)
Individual Markets
Hows the market going in you neck of the woods? I now have stats for all areas in western Nevada County. Some quick observations:
Data in Grass Valley and Nevada City generally mirror the data for the whole County
Nevada City has a slightly higher supply of 6.7 months
Lake Wildwood had a strong August but summer sales were down 9.2% from 2018.
The Alta Sierra sales prices have flattened out after declining at the end of 2018
South County/McCourtney has 8.2 months of homes currently listed (95 listings) with an average List Price of $806,321.
Areas with low monthly sales volume can have statistics that are skewed such as North San Juan, High Country/Washington, Smartsville/Big Oak Valley, and Rough and Ready . Its good to concentrate on the Months Supply and compare it to the county as a whole
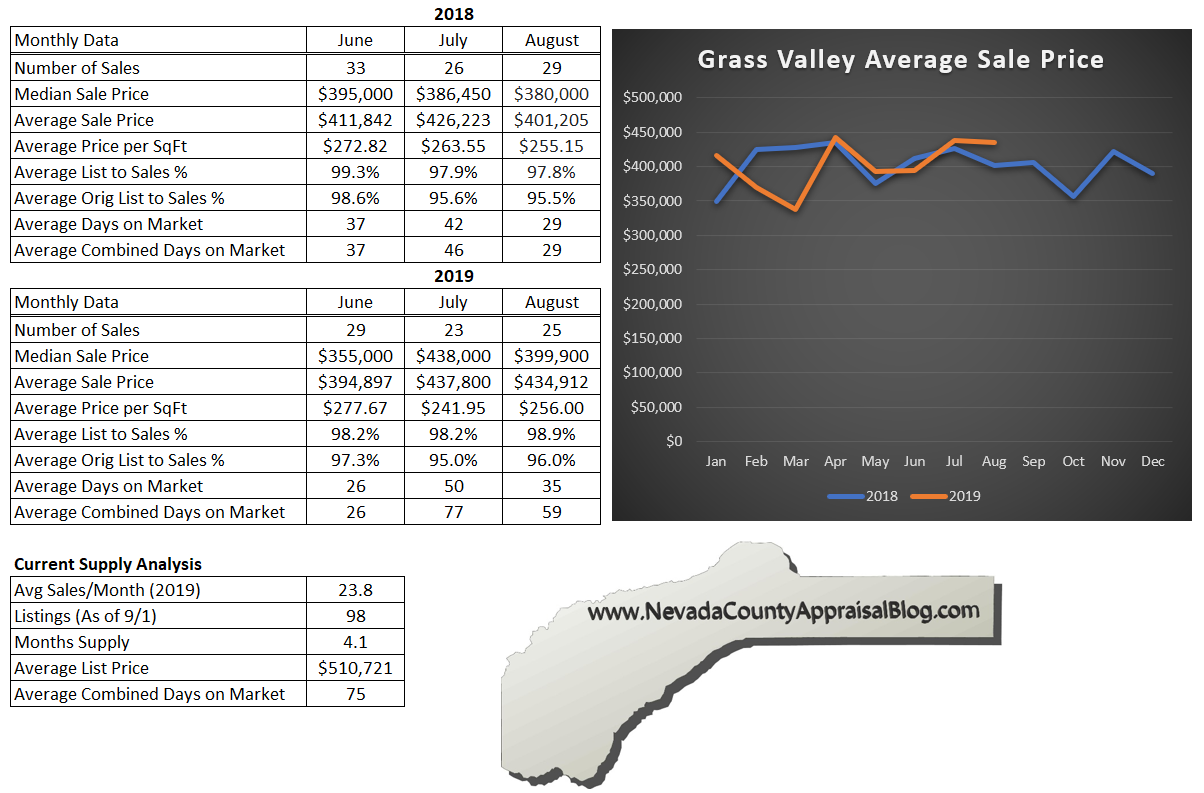
Grass Valley
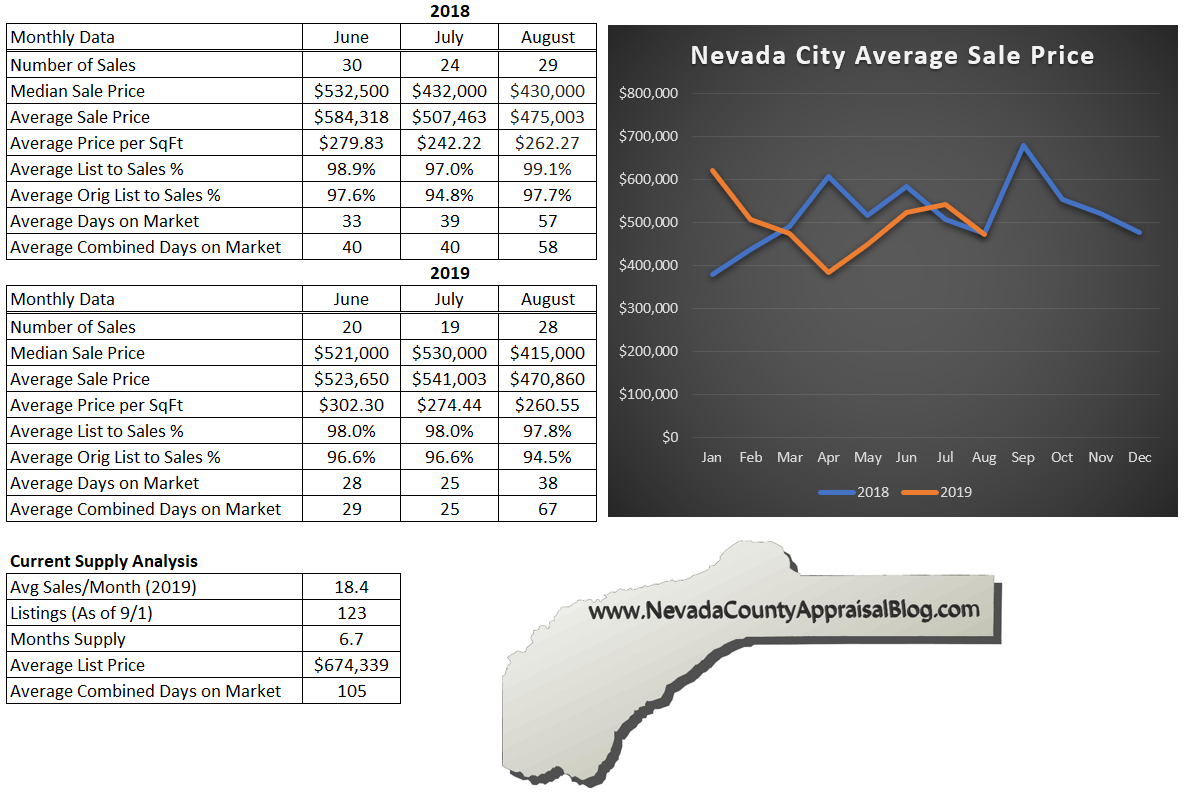
Nevada City
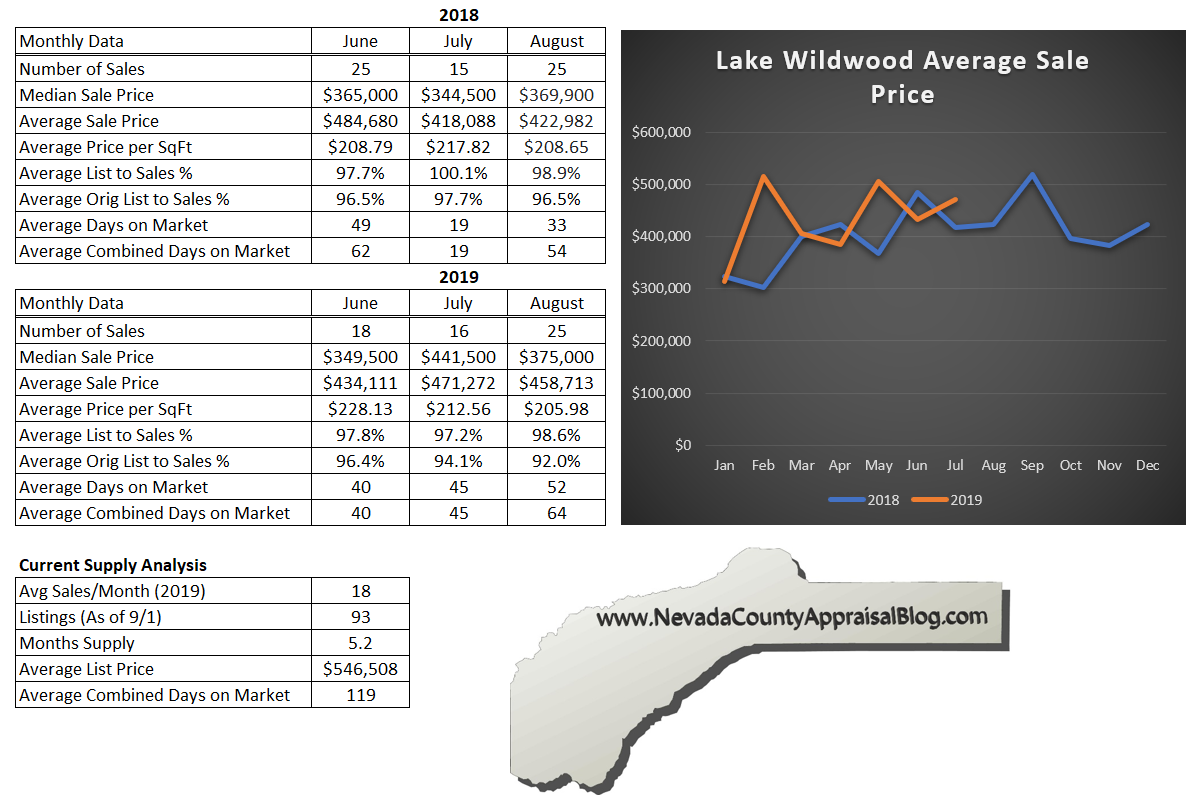
Lake Wildwood
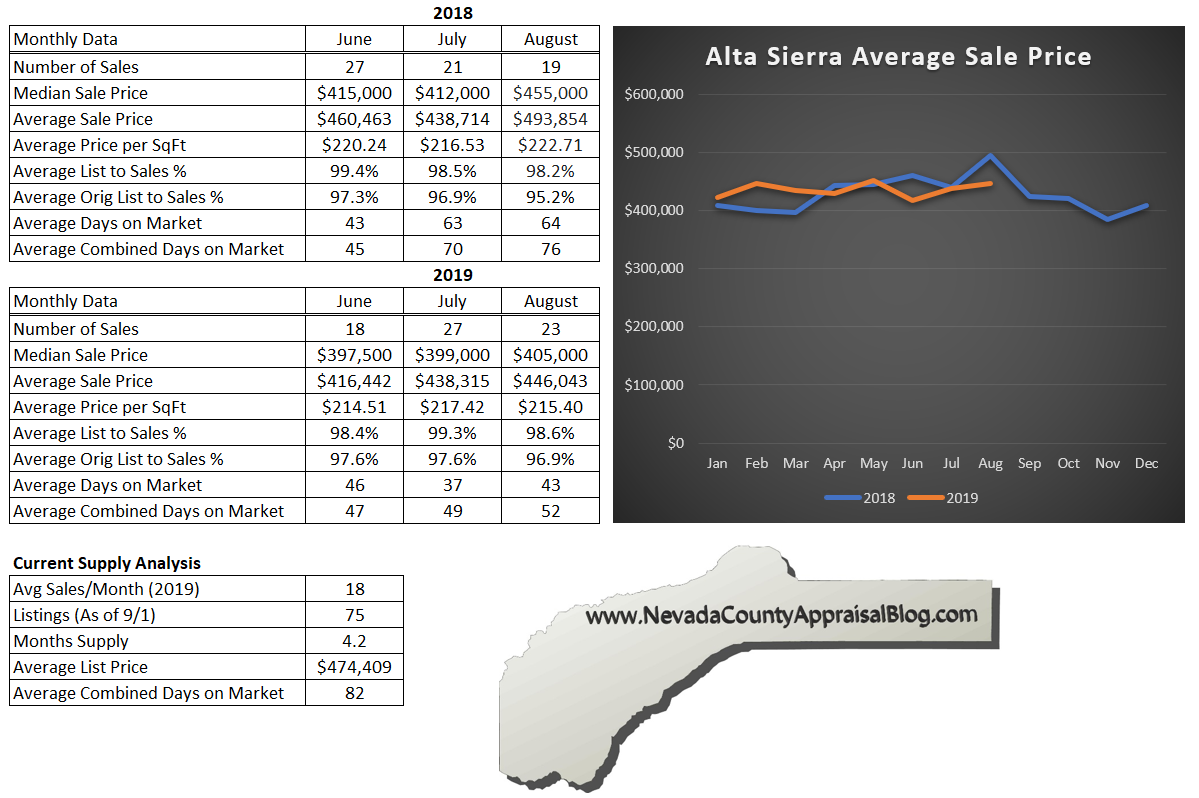
Alta Sierra
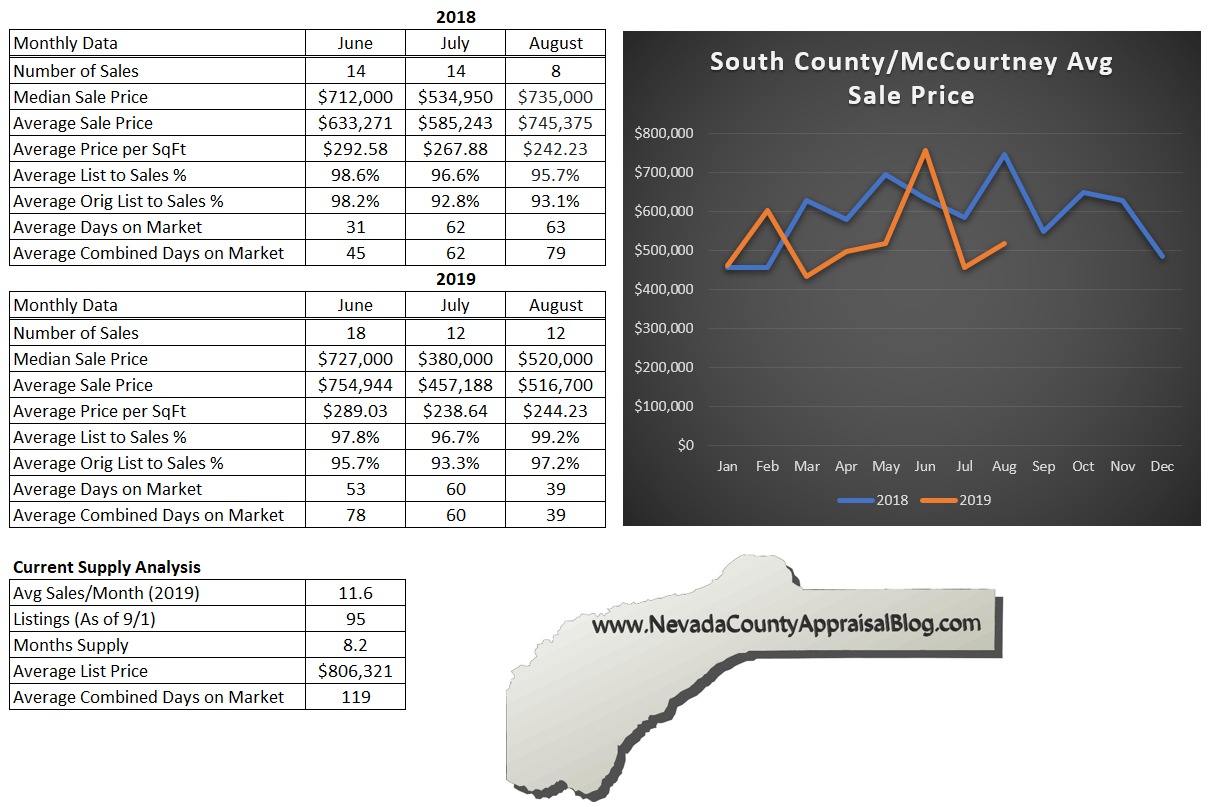
South County/McCourtney
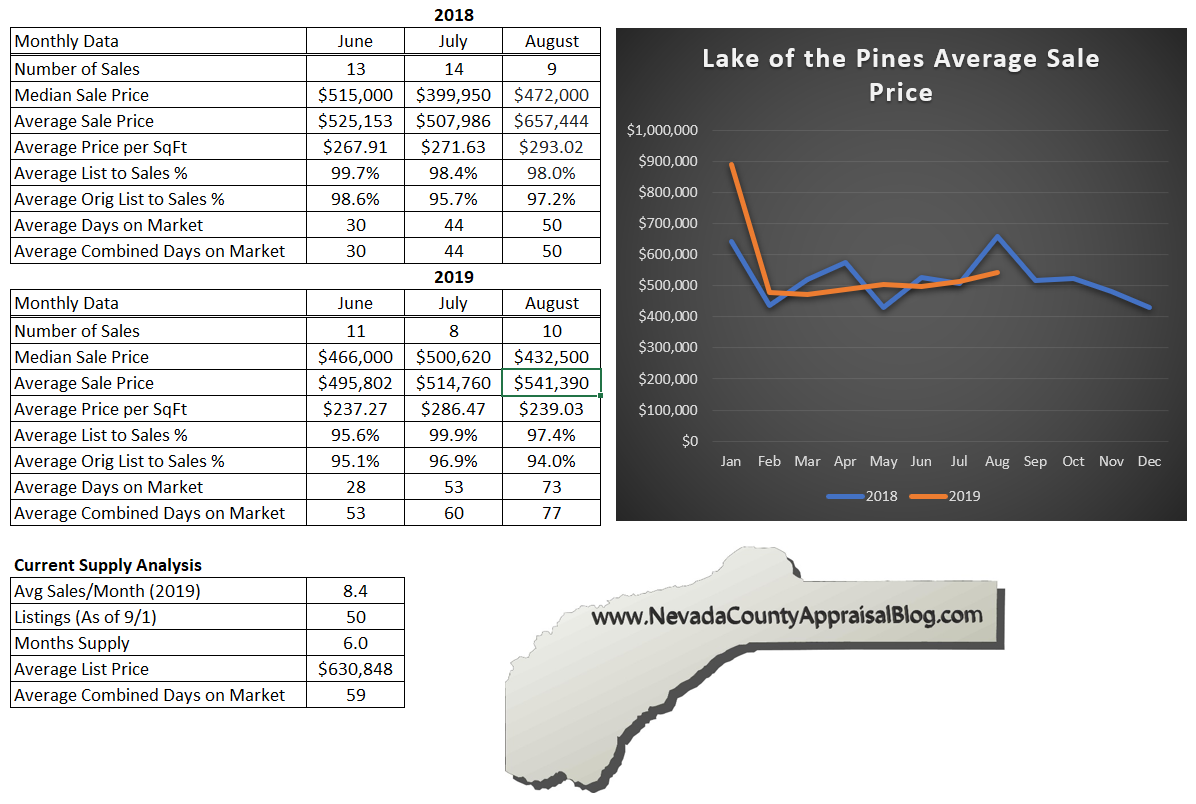
Lake of the Pines
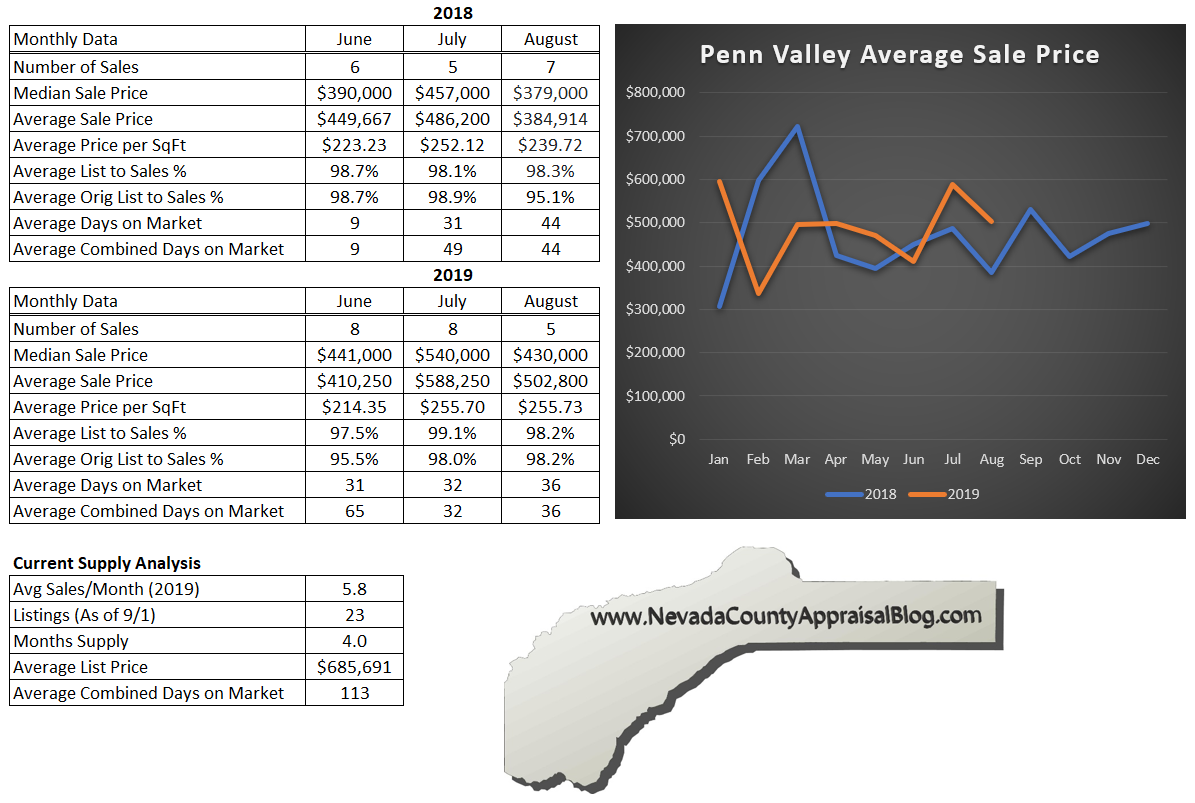
Penn Valley
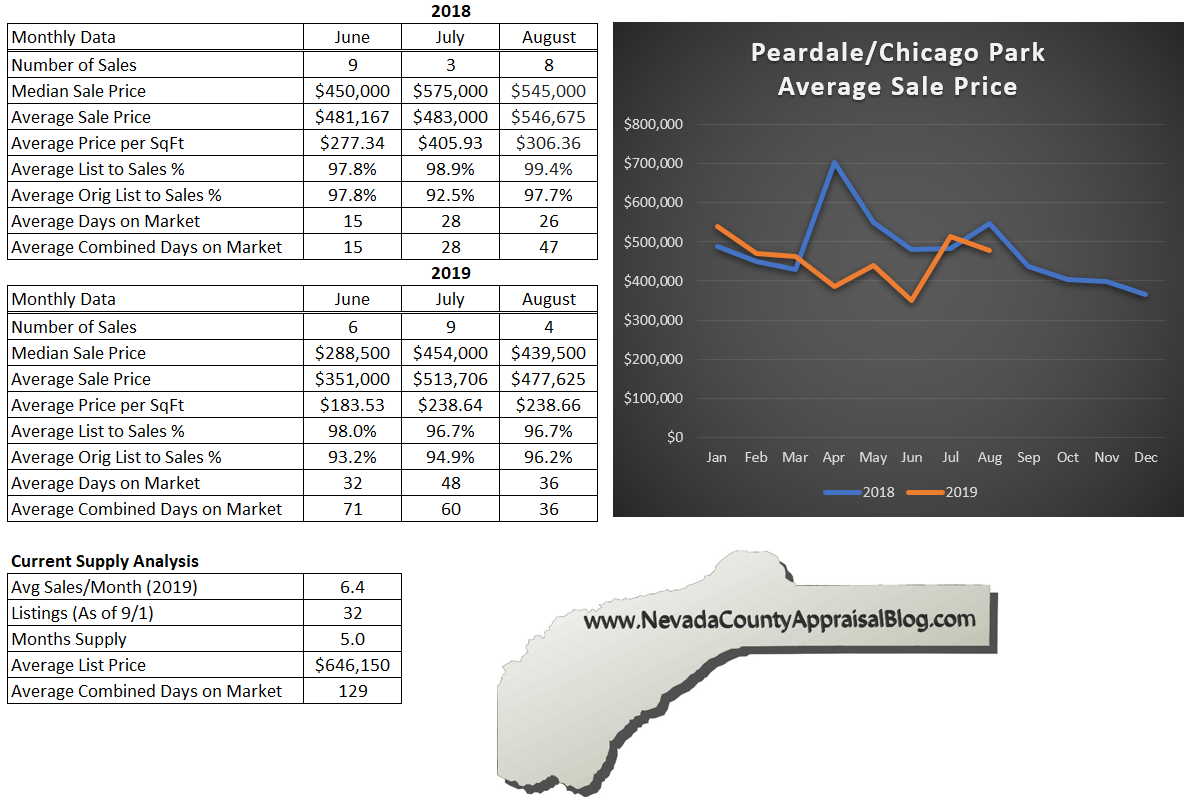
Peardale/Chicago Park
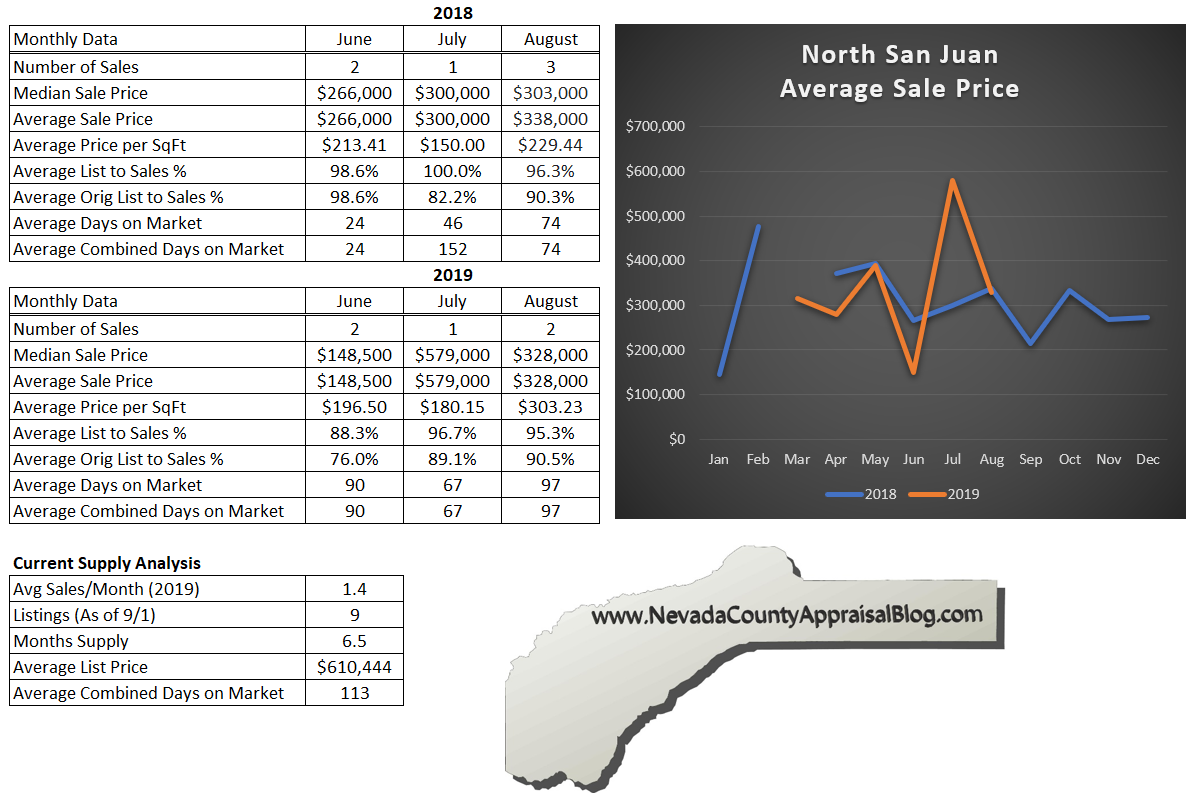
North San Juan
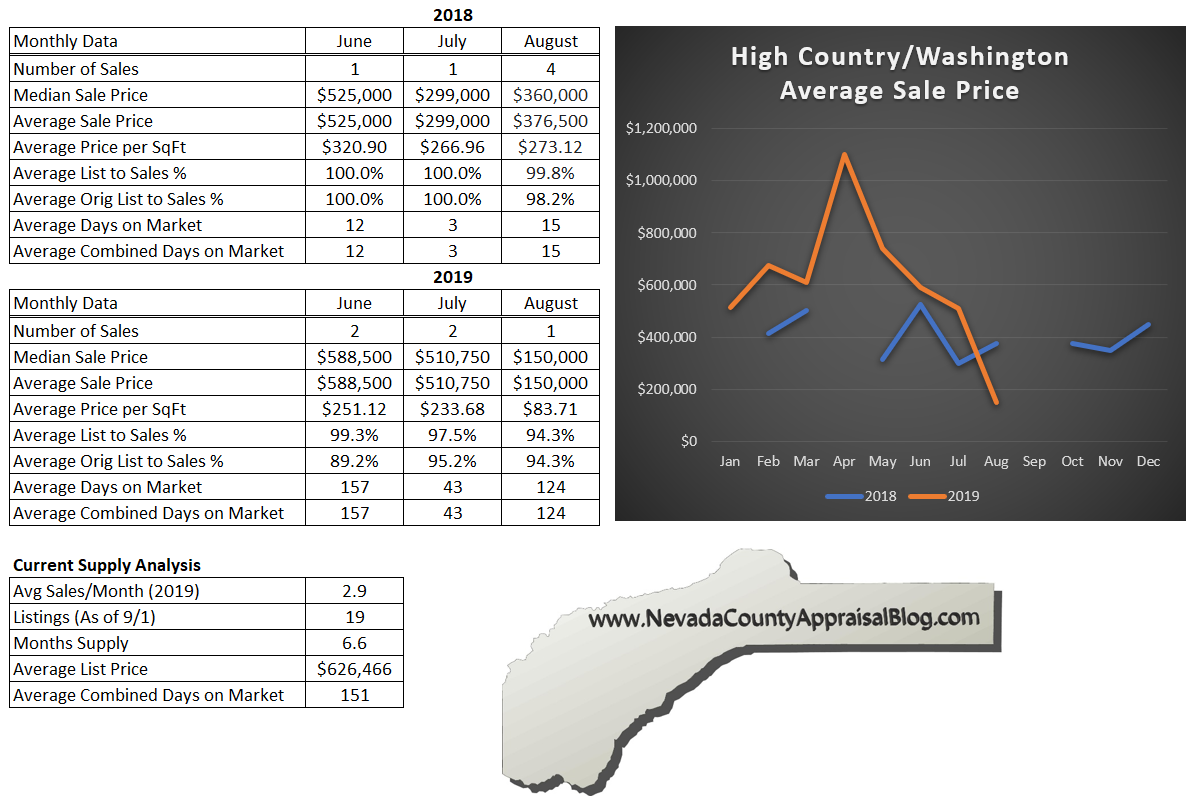
High Country / Washington
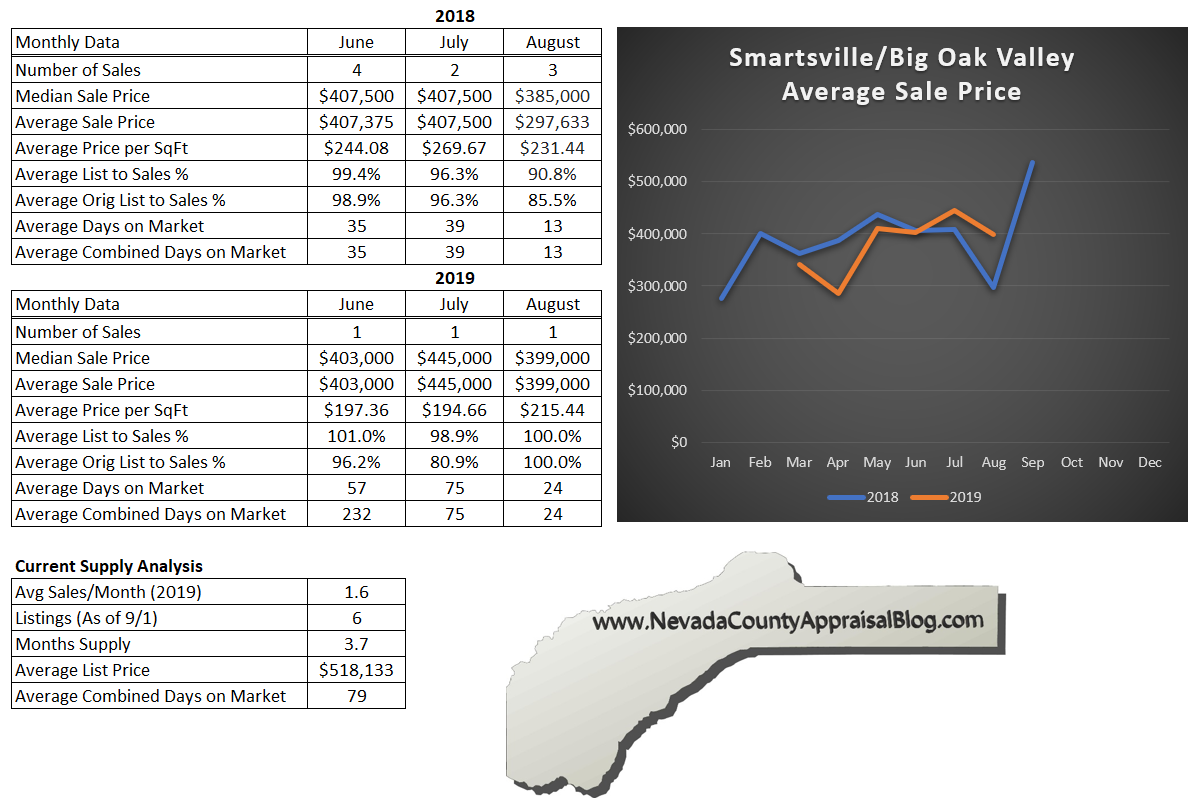
Smartsville/Big Oak Valley
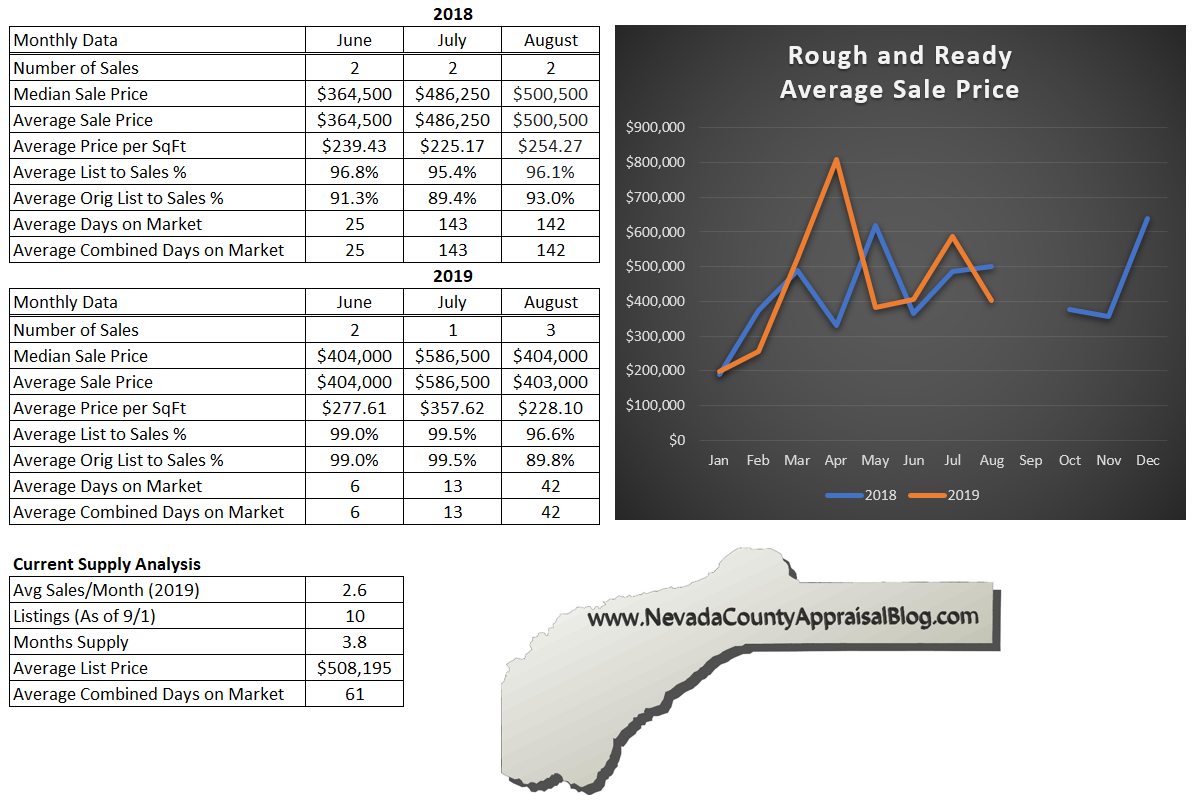
Rough and Ready

Nevada County Appraisal Blog's Fire Insurance Analysis 2019

Archive note: This article reflects the information and market conditions available on its original publication date. Requirements and conditions may have changed. Confirm current guidance with the relevant authority before relying on the article for a present-day decision.
Hi all- Becky Hindt here- I’m the office manager for Sierra Nevada Appraisal Group. After receiving dozens of questions (from clients and friends alike) about the state of fire insurance in our area, Brian and I decided we should dig into this topic and make it the focus of a blog post. In the wake of the catastrophic California wildfires of the last few years, specifically the devastating Camp Fire in Paradise, Nevada County homeowners are finding themselves being dropped from their insurance companies or are seeing rates sharply increase. As temperatures rise and vegetation continues to dry out, homeowners are scrambling for coverage as well as answers. Recently, Brian conducted several interviews with local real estate and insurance professionals to gather as much information as possible on the current state of fire insurance in our area.
We all know that insuring our valuable assets, whether car, home, or personal items, is important in the case of destruction or theft. We want to know we will be able to replace our property in the event of a catastrophe. Lenders also want to know they will be able to get their money back if something happens to the asset they are loaning on. This is why lenders require homeowner's insurance. Typically, a homeowner’s insurance policy will cover any damages to your home caused by fire. However, with the ever-increasing threat of wildfires in California, many insurance companies aren’t renewing policies in high-risk areas like ours.
Unfortunately, insurance companies that are providing policies are drastically raising their premium prices, as Movement Mortgage lender, Heidi Seavers, attested when she spoke about rising monthly premiums. “I can count on one hand the policies I had in the last two years that were $3000, but now, I can count on one hand how many policies I’ve gotten in the last six months that were less than $900… there has been one.” According to Ms. Seavers, the pre-Camp Fire policies she saw in the $3000 range were justified in their pricing; perhaps the home was very rural or far from resources like fire stations. But now, even residents within the city limits are struggling to find insurance. There is a big red ‘X’ on much of Nevada County, and few are exempt.
All this gets more complicated when looking at how insurances companies operate, specifically, how they set their prices and determine who or where to insure. According to a local insurance agent, Mike Bratton, in addition to physical conditions like lack of rain, insurance companies have found themselves unable to charge appropriate premiums due to limits set by the California Insurance Commissioner. Basically, insurance companies aren’t able to charge what they feel they need to, given the high risk of our area, due to regulatory caps on rates. The rate increases homeowners are seeing (if they are lucky enough to be insured), is more of a sticker-shock since California has very low rates compared to the rest of the country. “We have something like the forty-fourth cheapest homeowner’s rates in the nation, and it doesn’t make sense because the cost of construction is probably in the top two or three. There is just no parody there,” says Mr. Bratton.
Ryan Harris, another Nevada County-based insurance agent with Harris Insurance Services, supplements this point by noting that most admitted insurance companies (those governed by the California Department of Insurance), are nationwide companies and are not based in California where they are subject to regulation. When catastrophic events occur, and the insurance companies file for rate increases to cover their higher risk, the insurance commissioner looks at how profitable the company is nationally and denies their rate increase petition. This leads companies to withdraw from areas or continue to offer insurance without fire coverage.
Harris goes on to explain that even non-admitted companies like Lloyd’s of London, are starting to view California as a catastrophic state, and have begun to raise rates. Because they are not regulated by the state, there are no laws capping rate increases for non-admitted markets. When admitted companies pull out, non-admitted companies can fill the vacuum with elevated prices and decreased coverage. Many homeowners have no choice but to fall back on plans from Lloyd’s or the state-provided California FAIR Plan.
The FAIR Plan has been getting a lot of buzz in this area lately since it is the only option for many homeowners to be insured for fire. According to their website, it is an “insurance pool established to assure the availability of basic property insurance to people who own insurable property in the State of California and who, beyond their control, have been unable to obtain insurance in the voluntary insurance market.” Created in 1968, the FAIR Plan has been a last resort for California homeowners to obtain insurance for perils like wildfire, windstorms, or internal explosion. Insurance and real estate professionals (and even the FAIR Plan’s website) emphasize that the FAIR Plan should be a last resort. It typically covers less and costs more than policies provided on the open market. In addition, a second policy known as a difference in condition or wrap policy is needed to cover the remainder of what the FAIR Plan does not. While having fire coverage through the FAIR Plan will lower wrap policy premiums, the FAIR Plan rates can reach as high as $8000 in some rural areas like North San Juan, according to local lender Stan Oparowski, with Northern California Mortgage.
A close friend and Rough and Ready resident has been updating me on her efforts to obtain insurance. After exhausting all other avenues, she will be settling on a FAIR Plan policy paired with a wrap policy from either AAA or Aegis. Like so many others this spring, she received the 60-day notice from her insurance company notifying they would no longer be covering her home. She has had to come to terms with paying almost two and a half times as much for less coverage this coming year. Having been evacuated due to the threat of the Lobo Fire last year, she knows how important adequate coverage is.
Where does all this leave Nevada County residents in the coming months and years? What can homeowners do to protect their properties without going bankrupt? Unfortunately, it is hard to know for sure. According to Mr. Bratton, all insurance companies are different in how they asses risk. Some companies want to see “pride of ownership” when they inspect a property. Are pine needles raked up? Is the grass green? Is there junk piled around the dwelling? Are railings and decks safe and secure? Sometimes this can be the difference between a thumbs up and thumbs down from an insurer. On the other hand, and what we are seeing with insurance companies now, entire areas are deemed too risky to insure, no matter how clean and safe an individual property is. Mr. Bratton is hopeful, though. “In the next two to three years, I think this problem will get better because I think the Insurance Commissioner’s office will help with appropriate rates… if you let the insurance companies try to grow their businesses, they are going to be competitive against each other. With that being said, expect rates on homeowners’ policies to go up over the next couple years.” He continues, “things have to change in order for us to get back to where the realtors can feel good about listing a house and selling a house and knowing that it’s going to close escrow because we can find insurance for it, because right now, I know that’s a problem.”
Mr. Harris agrees that the rate increase approvals will help. “If the admitted markets can get the rate approvals they need, it’s going to get better- it's going to create competition [and] lower exposure from the non-admitted markets.” He is cautiously optimistic, however, saying that our current situation could be the new normal. “If [insurance companies] can’t get the rate increase, the California FAIR Plan is going to be just like earthquake insurance; you are going to have to buy it separately, and every admitted market will exclude fire coverage from their policies.” Perhaps it is a wait-and-see situation. However, if yet another large fire strikes close to home this year, it is hard to imagine a scenario in which insurance doesn’t continue to increase or become harder to obtain. The Camp Fire, after all, was the last straw for a lot of insurance companies, according to Harris. It seems like all homeowners can do in the meantime, is continue to diligently research coverage, and really start to familiarize themselves with the FAIR Plan if they haven’t already.
Hopefully, this post provides some answers or insight into the current situation in Nevada County and other California communities. I’ve compiled some key points of advice based on the information received from the professionals featured in this blog:
If you are trying to buy a house, understand what insurance you can get first as this may affect your buying power significantly.
Be wary of generic computerized quote calculators online. We live in a very complex area in terms of real estate, and the generic tools available online that might work well for getting a quote in Roseville, may not be accurate here. With that said, if you find yourself resorting to the FAIR Plan, their website’s online calculator can help give you quick ballpark estimates based on the different additional coverage options you may want. That tool can be found at here.
Shop through a local broker who is familiar with the area.
Continue to review and call around. Coverage and policies change from time to time, so options may become available. If you currently have a good policy, STAY WITH IT!
Take video or pictures of personal property, so you know exactly what you have in case of destruction. Go through and document all rooms, closets, cabinets, etc. Save it to the Cloud or have a second copy that is not stored in your home.
Take care of your property! Maintaining defensible space around your home, cleaning debris from roofs, and maintaining your irrigation system are just a few steps you can take to make your property more fire safe.

49er Fire Map 1988
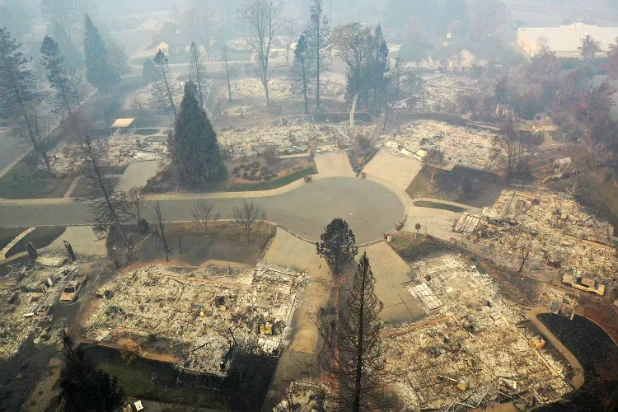
Camp Fire 2018

49er Fire, Nevada County 1998

Springing into the Summer Market

Thunderstorms, rain, and pea-sized hail make it seem like its the dead of winter, but spring is, in fact, winding down and it’ll be summer before you know it. That means BBQ’s, the Nevada County Fair, and heading to the river. It also means a large increase in housing sales. Historically, sales of residential homes in Nevada County can double or even triple when compared with winter months. Let’s take a look at how the 2019 market is shaping up.
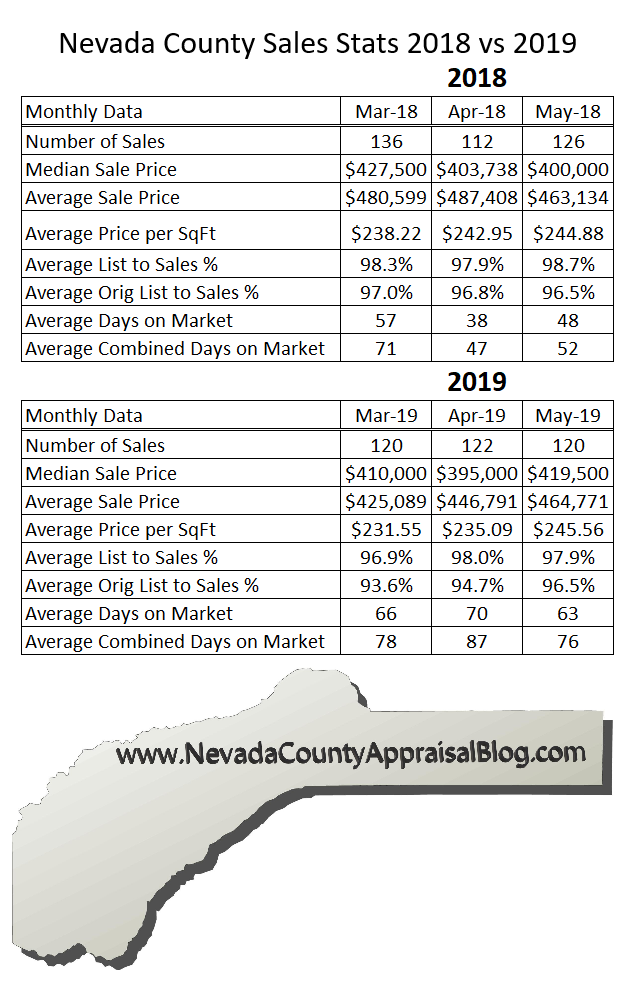
Looking at the data, this spring has been pretty comparable to spring of 2018. The number of sales remains strong with 537 total sales in 2019 YTD compared to 545 in 2018 through May. Comparing March - May 2019, we see 3.2% less sales than 2018.
During the last couple of years, prices appear to be overall stable. There are seasonal fluctuations in median and average prices, but no dramatic appreciation like in years past.
Original list prices to selling price percentage jumps out in March and April in 2019. This indicates that a seller may think their house is worth slightly more than it ends up selling for. Because sellers are pricing higher than market value, Days On Market (DOM) increases until listing prices are lowered. DOM and Combined Days on Market (CDOM) have both increased in 2019.
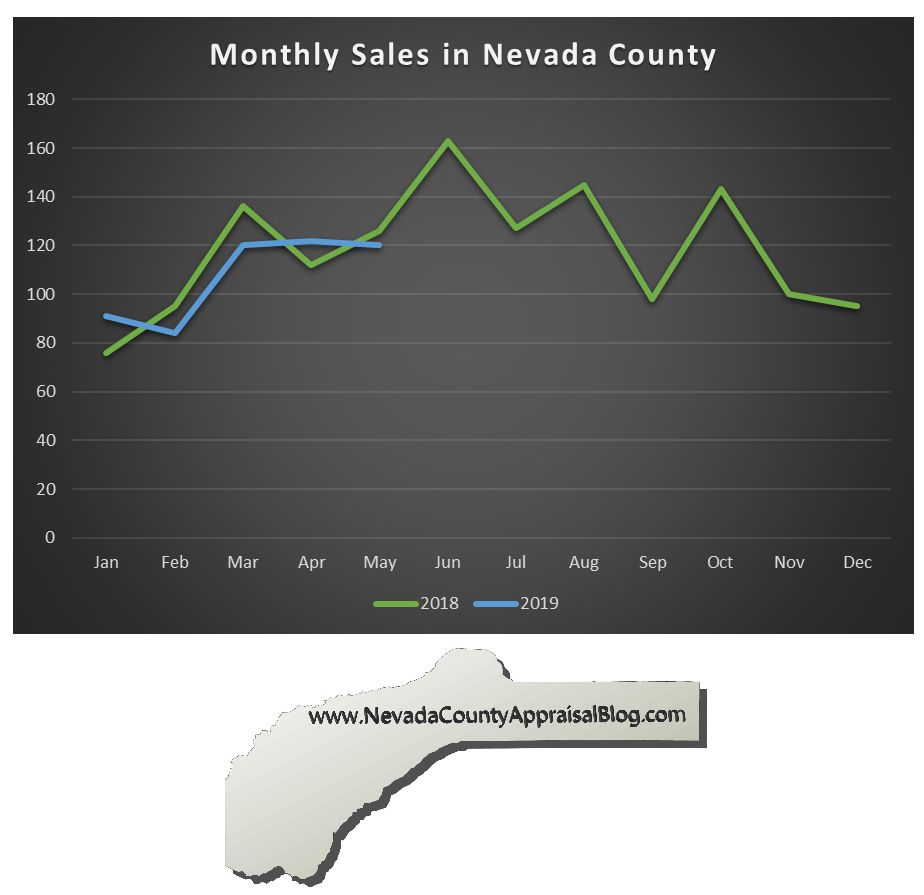
So far in 2019, monthly sales in Nevada County have been right on par with 2018. Real Estate Agents are working hard to close escrows in 2019 with an average of 107 sales a month. If the market is anything like 2018, sales should stay strong through summer.

Prices remain fairly consistent with 2018 as well. Both the median and average prices are very consistent between 2019 and 2018. If you bought a house within the last year or so, the value probably hasn’t decreased. However, you don’t have that instant equity buyers were getting in 2013-2016.

Days On Market has increased substantially in 2018. Monthly Average DOM has increased an average of 27% or 12 days in 2019. This is directly due to homes being overpriced when originally listed.

There are currently 513 homes listed for sale in Nevada County. Based on the average sales per month in 2019, this equates to a 4.8 month supply currently listed. This is slightly higher than 2017 and 2018, but less than the peak supply in August 2018 (5.8 months). In 2009-2010 it was typical to see 16-20 months supply of homes on the market.
Spring Market Conclusions
Prices are stable; both median and average sale prices indicate no appreciation or depreciation between 2018 and 2019. Supply is slightly higher than in years past but remain substantially lower than at the bottom of the market. Marketing times have increased over 2018. This appears to be directly due to higher listing prices.
Individual Markets
County-wide statistics give is a good idea on how things are going in general but it’s also important to look at individual markets. What’s happening in your neighborhood? I’ve included data and graphs for Grass Valley, Nevada City, Lake Wildwood, Alta Sierra, South County/McCourtney and Lake of the Pines. These numbers are especially helpful when I am completing an appraisal in these areas.
Grass Valley
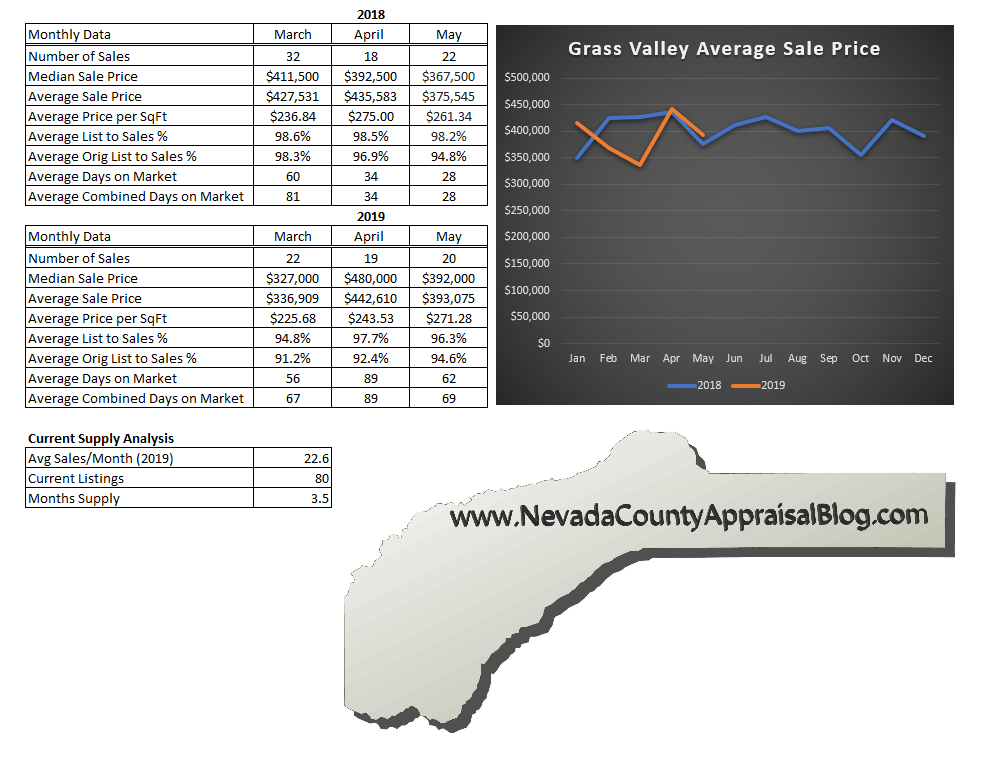
Nevada City

Lake Wildwood

Alta Sierra

South County / McCourtney

Lake of the Pines
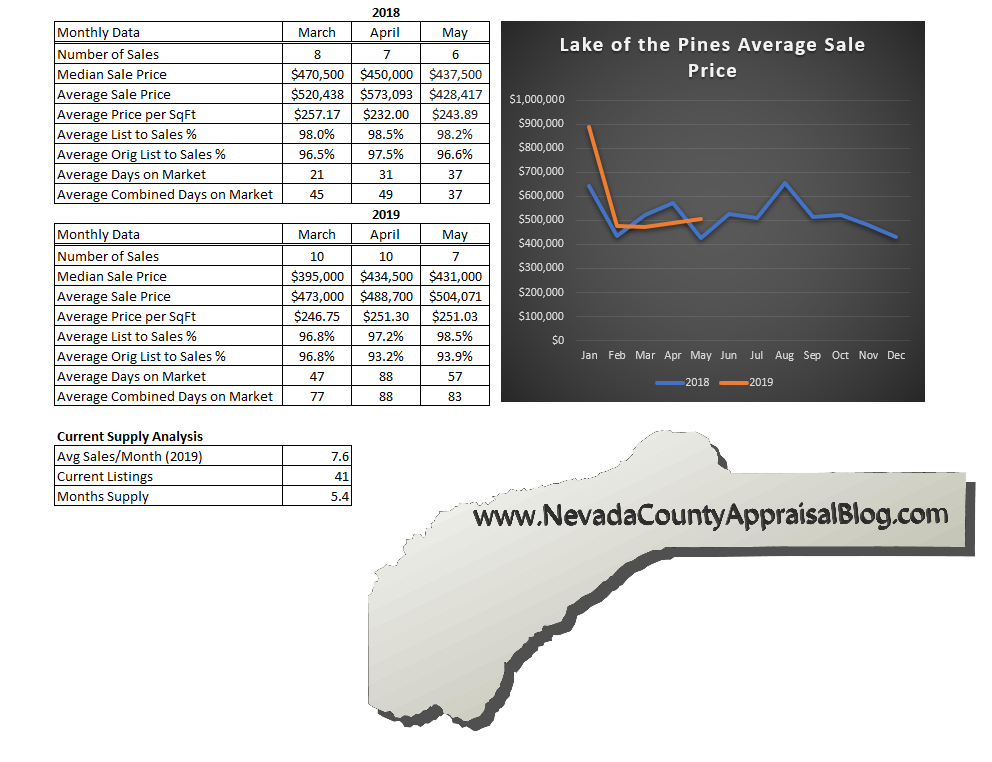
Penn Valley


Will My Summer Project Add Value to My Home?


Last summer, my wife and I decided to build a wood-fired pizza oven in our back yard. It was a very long and expensive process, but we love to entertain and eat delicious food, so it was worth it to us. The oven turned out amazing and the pizza is even better!
At one of our first pizza parties, we had numerous friends ask the question: “so, how much value does this pizza oven add to your house?” Truthfully, the answer is: probably little to nothing, but it can be hard to determine for sure. It all depends on how much the market would be willing to pay for that one unique, non-essential feature. The problem is, there are so few homes with custom-built pizza ovens; in the thousands of appraisals I’ve done in Nevada County, I’ve only encountered a handful. Furthermore, it's going to be very difficult for a real estate professional to prove the market is willing to pay anything more for a feature like a pizza oven. Did Bob Buyer make a top-dollar offer just because the house had a backyard pizza oven, or was it something else? With so few data examples to draw from, it can be very difficult to pinpoint.
Personally, our goal in building the pizza oven wasn’t to increase the value of our home. We enjoyed the satisfaction of building something with our hands and sharing the fruits of our labor with friends and family. And to eat the most delicious pizza ever. However, it can be a real shock and disappointment to sellers when they find out the fill-in-the-blank they worked so hard on and invested so much money in doesn’t actually add much (or any) value to their home. In this post, I’ve laid out some things to consider before you embark on a summer project.

So why doesn’t the fancy pizza oven necessarily add value to our home? To further illustrate, I’ll use the example of the Kohler Numi toilet. Imagine a homeowner decided to outfit their otherwise average condition house with the Cadillac of toilets- a Kohler Numi Elongated One Piece toilet (MSRP $10,400). According to their website, ‘Kohler's most advanced toilet now offers personalized settings that let you fine-tune every option to your exact preferences, from ambient colored lighting to wireless Bluetooth(R)* music sync capability to the heated seat and foot warmer. Other upgrades include Power-Save mode for energy efficiency, emergency flush for power outages, and an intuitive touch-screen remote.’ While this might give the homeowner ‘The Coolest Toilet on the Block, award’ it’s probably not adding any additional value to the home.
A family with a budget of $400,000 looking for a 3 bed, 2 bath house is not going to be willing to pay $20-30,000 more, exclusively for toilets that will dim the lights and play Beyonce every time you go number two. Or at least this is something that would be very difficult for an appraiser to prove. In homes that are very high-end, however, this type of amenity might be expected as part of that existing high-end price tag. In this case, a home with a $10,000 toilet probably also has the best finishes and amenities throughout the house. You aren’t typically going to see the Kohler Numi perched on 1970’s linoleum. But more importantly, just like the case of the pizza oven, there is so little data to draw from.
Consider your home and the current market. Just because you spend a lot of money or time on a project or amenity, doesn’t mean it will add monetary value to your home. If, however, your personal happiness will be made greater by a ten grand robot toilet with a name like a Kentucky Derby racehorse, knock yourself out.
Homeowners, Investors, and Agents ask me all the time about specific features adding value to a home. Here are some common items:

Kitchen – A kitchen remodel is one of the most common upgrades homeowners make. The cost can range from $15k to $150k. Typically, a kitchen remodel has a good return on investment. Remember paying more for that one super high-end model of stove probably isn’t bringing that cost back in value.
Bathrooms – Probably the easiest and most inexpensive remodels in a home. A bathroom remodel can bring a very dated home into the modern world and buyers will notice this.
Paint – A coat of paint can go a long way. Neutral colors can give a home a fresh look and paint a blank canvas for buyers to envision their new home.
Floor Coverings – Soiled and stained carpet can really turn off buyers. Even the brown shaded carpet from the ’80s can be a real turn off for buyers. New floor coverings spruce up an older home.

What about a golden toilet? (Side note - supposedly one was offered to the White House, but Trump turned the offer down). If a toilet weighs as much as a normal porcelain one (70-120 pounds), a golden toilet would cost anywhere between $1,374,266 - $2,355,936. Based on the price of gold in Sept 2016, the toilet (actually the gold) would have decreased in value $100,326 or 6.8%. Pretty crappy if you ask me!
Pizza Ovens and Expensive Toilets – In the appraisal world, its called a super adequacy item. Imported roof tiles from a church in Italy and marble from the desert of Egypt (both items I have run across before) probably aren’t going to add any more value than materials that are available locally. Buyers just typically aren’t willing to pay for these little luxuries that are personal to the seller.
Landscaping – Here’s where things get a little less black and white. While some landscaping is more valuable than no landscaping, the extent of the landscaping and water irrigation probably means very little when determining the value of a home. It's great to look at your brand new $80k landscaped back yard, but is the market paying more than the average landscaped property next door? Maybe a little, maybe not.
Additions – While adding to the square footage of a home is definitely going to increase the value of the home, the cost typically greatly outweighs the increase in value. Most cost of new construction I see ranges from $200-$300 per square foot, but the market typically reacts between $65-100 per square foot of additional living space. The addition may not be the best return on investment.

Pools – An average in-ground pool in Nevada County can run between $40,000 - $200,000. The market reaction to pools can be quite different. Demand is key. If you lived in Palm Desert where the average high temperature during the summer months is 102-105 degrees, the market would demand almost every home have a pool. Compare that to an average temperature of 80-87 degrees during summer months in Grass Valley. When I’m appraising homes throughout Nevada County, I typically see a market reaction of $5,000 - $25,000 depending on the quality of the pool. The cost will always outweigh market reaction for pools, but they sure are fun on those hot summer days! ***Reminder – An above ground pool is typically considered personal property because it can be easily broken down and moved. Similar to an above ground hot tub or spa, these items are not taken into consideration when establishing a market value for a property even though they may be included in the purchase of a home.
Barns/Outbuildings – Market demand is going to be another key factor with barns and outbuildings. In Lake Wildwood there is very little demand for a large workshop or an eight stall barn. In South County and McCourtney areas, a barn is a must. I’ve seen the market willing to pay anywhere from $5,000 - $50,000 for these types of structures.
Granny Units / Accessory Dwelling Units – These types of structures can range from a detached guest bedroom and bath to a 2-3 bedroom home with a full kitchen and garage. I’ve completed an extensive analysis of ADU’s and found the market is willing to pay of 5%-25% for an ADU on a property. For a $600,000 home that’s $30k - $150,000k. Again, the cost is a key factor in ADU’s. Typically the cost outweighs the return.

Smart Home Upgrades – Smart home accessories have become a huge industry. There is everything from wireless learning thermostats, remote locking doors, video doorbells, automatic interior lighting, voice-controlled window shades, and a refrigerator that live-streams a camera so you can look inside from the grocery store. While these gadgets are cool, technology is growing at such a rapid pace, these individual upgrades can be obsolete in a few years, so probably won’t add much additional value too the home. However, when many smart home items are put together, they can add a cool techie vibe to the home which may sell your home faster than a similar home that you have to write down your grocery list physically.

Solar – I could (and probably will at some point) write an entire blog post on solar electricity, so this is going to be pretty concise. Overall, I would say the Nevada County market is willing to pay more for a home with solar electricity than without solar electricity. This makes sense as the PG&E bill is going to be less on a home with solar. Each system is uniquely designed specifically for that home and can have so many different factors: How large is the system, when was it installed, how efficiently is the system oriented towards the sun, do trees obstruct the sun at parts of the day, etc. Right now, a real estate professional doesn’t have the answers to those questions for every home they appraise, nor every comparable, so an exact analysis is impossible to complete. An analysis completed in 2015 by Sandra Adomatis, SRA, LEED Green Associate and Ben Hoen, Staff Research Associate at the Lawrence Berkeley National Laboratory found “the average premium for all study areas is $14,329, which is 3.74% of the average sales price and equates to $3.78/W … this premium is considerably lower than the average gross cost estimate of $5.48/W. ***Leased vs. Owned – Leased equipment is almost always considered personal property and won’t be considered in the market value of a home. Most lenders require that leased solar systems not be included in the value of a home.
In Summary
The common theme throughout this list of upgrades and remodels is the cost is usually going to outweigh the return on value. I know HGTV makes it tempting to install a water feature or the latest tech upgrades, but in reality, there are very few upgrades that will give you a dollar-for-dollar return on investment. When considering upgrades or amenities, it’s best to first ask yourself if you are doing it for personal pleasure and use, or to increase the value of your home. If your answer is the latter, consider the tips I have laid out, as well as the current market. Otherwise, make some dough, fire up the oven, and enjoy the personal touches and luxuries you have added to your home!


The Accuracy of Zillow

A real estate professional is often asked: Just how accurate is Zillow? If I had a nickel for every time a homeowner has mentioned Zillow when doing an appraisal … I’d have a ton of coins! Zillow can serve a useful purpose in any real estate market. In some markets maybe it can be a reliable indicator of what market value might be and in more complex markets perhaps its starting point or a reference point. I though it would be a great idea to dive into the accuracy of Zillow and its Zestimate for Nevada County. I’ve asked some of my local appraiser friends to look up some of their recent appraisals to compare an unbiased human appraisers results, to an automated Zestimate.
From Zillow.com
What is a Zestimate?
The Zestimate® home value is Zillow's estimated market value for an individual home and is calculated for about 100 million homes nationwide. It is a starting point in determining a home's value and is not an official appraisal. The Zestimate is automatically computed daily based on millions of public and user-submitted data points.
Is the Zestimate an Appraisal?
No. The Zestimate is not an appraisal and you won't be able to use it in place of an appraisal, though you can certainly share it with real estate professionals. It is a computer-generated estimate of the worth of a house today, given the available data. Zillow does not offer the Zestimate as the basis of any specific real-estate-related financial transaction. Our data sources may be incomplete or incorrect; also, we have not physically inspected a specific home. Remember, the Zestimate is a starting point and does not consider all the market intricacies that can determine the actual price a house will sell for.
Zillows Accuracy

The Zestimate’s accuracy depends on location and availability of data in an area. Some counties have deeply detailed information on homes such as number of bedrooms, bathrooms and square footage and others do not. The more data available, the more accurate the Zestimate value.
Zillow's accuracy has a median error rate of 5%. This means half of the home values in the area are closer than the error percentage. For example, in Seattle, Zestimate values for half of the homes are within 5% of the selling price, and half are off by more than 5%.
Brian’s Test
I studied 30 recent appraisals completed by myself and other local licensed real estate appraisers. For confidentiality reasons I did not know the properties or details of the homes, I was studying the appraiser's results vs. the Zestimate.
Results
Of the 30 recent appraisals, 47% of the Zestimates were higher than the appraised value. The range was 1% to 72% higher than the estimated market value. On average, the Zestimate was 20% higher than the appraised value (when the Zestimate was high).
The Zestimate was lower than the appraised value 53% of the time. The range was 1% to 57% lower than the estimated market value. On average, the Zestimate was 11.6% lower than the appraisal (when the Zestimate was low).
Altogether the average difference between the appraised value and the Zestimate was +/-15.5%. What does that mean? If the Zestimate of a home is $500,000, on average the market value is between $422,500 and $577,500.
What the heck Zillow?
Nevada County is an extremely difficult market to assess market value accurately. Zillow or any mathematical formulas, which are typically based on public records data, are always going to struggle in non-conforming areas. This is because of the wide range of qualitative features of a home. My home is a perfect example, the house next door is far inferior quality (and I’m guessing condition by the tarp on the roof) but the home directly across the street is far superior. Zillow is always going to struggle in markets like these where it cannot assess anything outside physical attributes.
Zillow has a much higher accuracy rate in markets where homes are much more similar. Parts of Roseville, CA would be a great example. Tract home subdivisions where most of the houses were constructed with overall similar quality and are in overall pretty similar condition lead to a much more accurate Zestimate. The only major differences are lot size, square footage, number of bedrooms and bathrooms, etc. Notice all of these things are actual numbers, which a mathematical formula can solve for.
What We’ve Learned
Zillow can be a starting point …. sometimes. I asked the appraisers about the homes where the Zestimate was over 30% off from the appraiser's results. The common theme was that this was a very complex property. All of them were either lakefront, large acreage, Victorian style, Fair/Poor quality, etc. For these types of homes in Nevada County, the Zestimate most likely won’t be accurate. Even for non-complex homes, Zillow may be just a starting point, let's say within +/-15%. If you really want to know the value of a home, you are going to have to hire a local, knowledgeable professional.