
Article Archive
Browse the full collection of appraisal articles, local market updates, and practice notes. Original publication dates help place each article in context.

Lake Wildwood - An In Depth Look

When I was 16, I worked for the Lake Wildwood Golf Pro Shop driving the cart that picks up golf balls. On an hourly basis I’d get in the caged golf cart and drive back and forth on the driving range, and as I’d get closer and closer to the practice tees I could see everyone’s eyes light up; I was a moving target. Sometimes I’d be listening to Pearl Jam on my Walkman (we had these things called cassette tapes back then) and a loud bang would rattle the top of the cage … bulls-eye!
Sometimes real estate can be a moving target too, especially in a complex area like Lake Wildwood. Never fear, I will be your caged golf cart target, providing you with an in-depth look at the different markets within Lake Wildwood.
What is Lake Wildwood?

Lake Wildwood is a gated community in the scenic Sierra Nevada Foothills of Northern California. Nearly 3,000 private homes are located in a lush wooded setting on a large and beautiful lake. Lake Wildwood is a private gated PUD community that can only be accessed by its members and their guests. The PUD development features approximately 3,000 homes, an 18 hole golf course & driving range, a golf pro shop with adjacent sports bar, a Jr. Olympic swimming pool and wading pool, 6 tennis courts, clubhouse with bar and dining facilities, RV storage, lake, and numerous ponds, 6 developed parks, 84 slip marina, and 24-hour public safety.
On a personal note, my family moved to Lake Wildwood when I was 4 years old. I attend Pleasant Valley School from kindergarten through 8th grade. When I was in high school, I worked in the golf pro job, as mentioned, for the public works department during the summer weed-whacking vacant lots and greenbelts, and also as a lifeguard and swim coach at the community pool. Go Water Otters!
Historical Outlook
Data from 2010 shows how the real estate market in Lake Wildwood has changed over the years.

As is the trend throughout the county, prices and sales bottomed out in 2011-2012 but have continued to recover through 2018. The last column shows data from the prior 6 months. It's interesting to see the Absorption Rate (a fancy way of saying sales per month) and median prices have slightly decreased when compared to all of 2018. The Absorption Rate decreased by 24%, and median prices reduced somewhat by 2%. Based on the prior 6 months of sales there is a current supply of 4.05 months (52 Listings).
Price Ranges
In 2018 the high sale in Lake Wildwood was $2.25 Million, and the low sale was $178,000. This goes to show there are a variety of submarkets within the gates of Lake Wildwood. I’ve chosen a few price ranges to analyze to show changes since 2010.
Under $300,000


In 2010 70% of the sales in Lake Wildwood were under $300,000. In 2018 that number shrank to only 26%. The graph shows all sales since 1/1/2017 and indicates a very stable market. This is entry-level homes within Lake Wildwood which has historically been a solid market and remains in a shortage.
$300,000 - $450,000


The $300,000 - $450,000 is currently the largest market within Lake Wildwood. In 2018 50% of the sales were in this price range. In the prior 6 months average and median prices have slightly declined compared to 2018 and average DOM and CDOM have slightly risen. With 26 homes currently listed this price range is overall in balance.
$450,000 - $600,000


In 2011 only 3% of sales were within the $450,000-$600,000 price range. While this grew to 18% in 2018, this price range is well above the 2018 median price of $353,500 for Lake Wildwood. These types of homes are the higher quality, larger square footage homes that may be located on the golf course. There are currently 11 homes on the market within this price range and is still considered balanced.
Above $600,000


Homes that sell above $600,000 within Lake Wildwood are typically the waterfront and/or specialty homes. There isn’t much market activity between the $600,000 - $800,000 range, but pick up when you get into $800,000 and above range. Many of these homes are waterfront. As expected, activity in this market is much slower with historically higher marketing times.
Golf Course Homes

Golf Course homes have different levels of quality and prices have ranged from $238,000 - $739,500 since 1/1/2017. The median price of golf course homes is significantly higher than the overall median price for Lake Wildwood (23.7% higher), but this could be due to higher quality construction and larger living area. Marketing times similar to all of Lake Wildwood and there are very few homes currently listed for sale.
Lakefront Homes

The lakefront market is easily the most complex market within Lake Wildwood. Since 1/1/2017 Most lakefront homes have been between $500,000 and $1.5 Million but there have been a few homes sold over $1.5 Million 2015-2018. There are probably 3-4 submarkets of lakefront homes in Lake Wildwood, and all are incredibly complex to track. Currently, there are 5 listings of lakefront homes ranging from $935,000 - $1.95 Million.
Conclusion
Lake Wildwood is a complex market with a variety of price ranges. As expected the lower price range below $450,000 is a stable market that is typically undersupplied. As price ranges increase, markets become less stable, and inventory rises. There are some specialty markets such as golf course homes and lakefront homes which can sell substantially higher.
This analysis was completed at the request of one of my loyal readers, Robin Hamilton of RE/MAX Performance. Please let me know if you have any comments or topic request. I love feedback in the comments below or by email at brian@snappraisal.com.

New Year, New Market?
Last week I woke up to the alarming news from the National Association of Realtors that existing home sales are down 10.3% from last year and were down 6.4% from November. Is the sky falling? Has the $#@% officially hit the fan? Is this 2007 all over again?
Pump the brakes. National and regional trends play an essential role in the analysis of the greater housing market and what the future may hold, but we need to look at local data for the most relevant trends. Today I’ll analyze some of the patterns for the Nevada County market as a whole. For specific market updates, I’ve updated the Nevada County Market Updates page for each region. Its a great source of independent data to show buyers and sellers what's going on in the specific neighborhood. I utilize market-specific data in all appraisals in Grass Valley, Nevada City, and the surrounding areas.
Year over Year Analysis
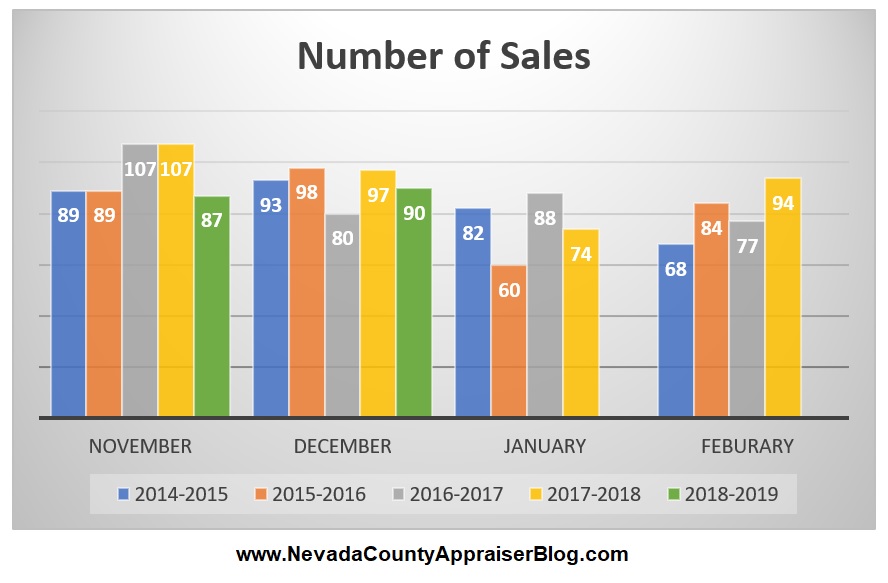
The number of sales in Nevada County was down 7.2% from December 2017, but actually went up 3.4% from November. January and February are traditionally the slowest months of the year so don’t be too concerned if the market seems slow.

New listings in Nevada County shot up in both November (+17.8%) and December (+20.6%) over 2017. The increase in new listings indicates the market may be sensing that now is the time to capitalize on the maximum equity. This also means there is going to be more competition. Will 2019 be more of a buyers market?
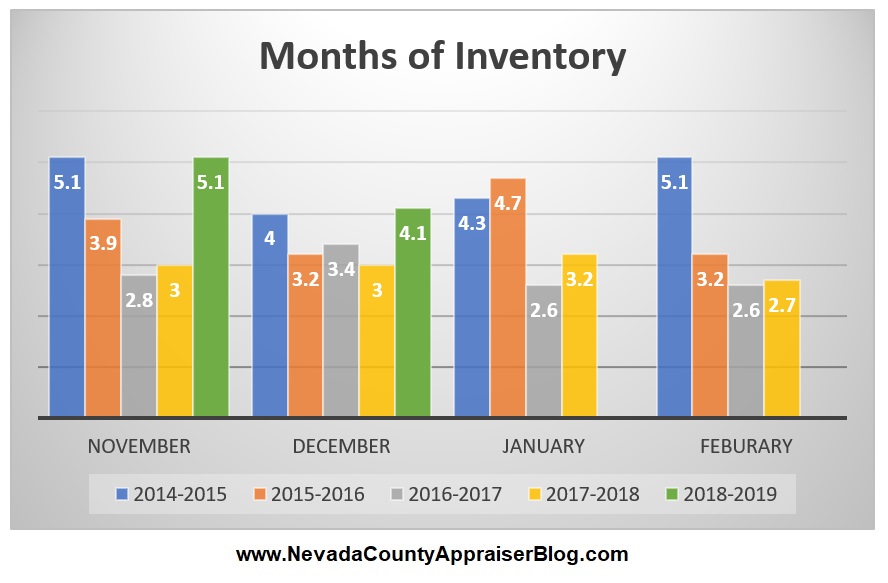
With fairly steady sales and a jump in new listings comes an increase in months of inventory. Months of inventory jumped 70% in November and 36% in December vs. this time last year. The last few years have been an overall shortage. Today’s Nevada County market, as a whole, appears to be balanced.

Average Days on Market did increase from November (+27.2%) and is up from December 2017 (+52.2%) but still remains a typical marketing time range. Average DOM typically increases in January and February.
What About Prices?
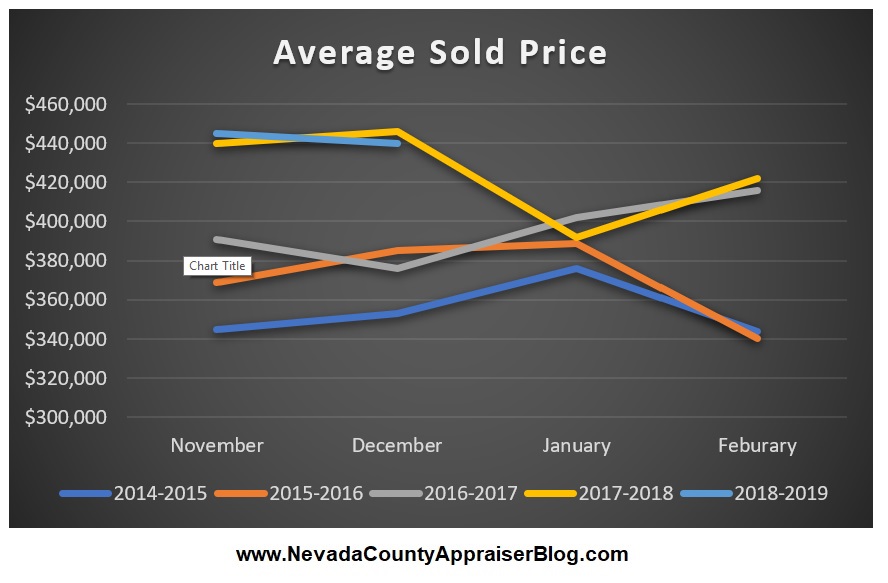

Average and Median Sold Prices remain consistent with 2017 in January and December. 2017 and 2018 sold prices were substantially higher than 2014-2016.

The average active price for 2018 is in the middle of the pack. This may be due to realistic expectations of the market’s current inventory and competition.
Summary
Overall, the current Nevada County market appears to be pretty stable with a slight increase in active listings and overall inventory. Median and Sold Prices and the number of sales is remarkably consistent with 2017. Days on Market has slightly increased but remains at a reasonable level.
How Far We’ve Come
Take pride in how far you've come. Have faith in how far you can go. But don't forget to enjoy the journey - Michael Josephson
Below I’ve highlighted specific price ranges and the number of sales each year since 2010.

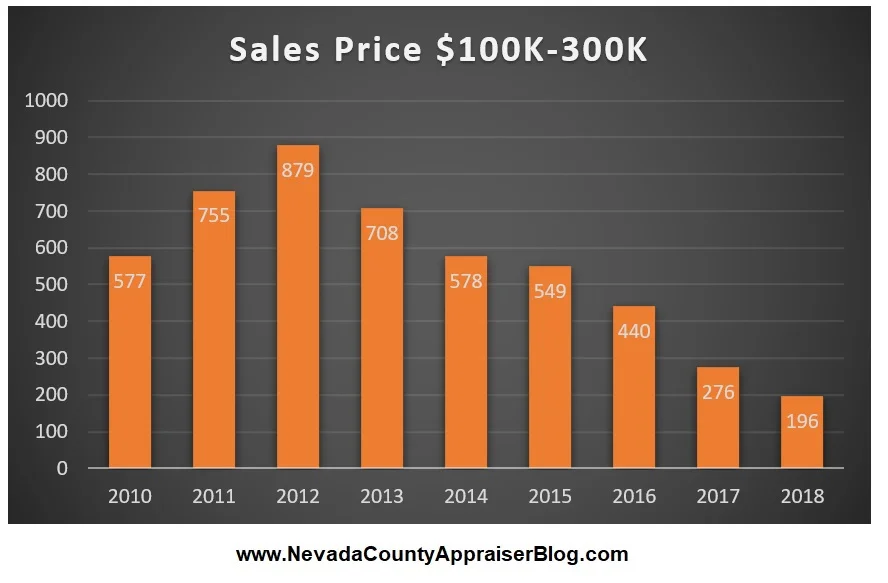


These graphs show how the affordability of homes in Nevada County has changed since 2010 and how the higher end market has dramatically expanded.
As always, if I’ve missed anything or if you have any general comments, please feel free to comment below or email me at brian@snappraisal.com. I love to hear feedback!

Happy Holidays!
I’d like to wish a sincere happy holidays from my family to yours. Each year around this time, I like to reflect on the challenges and successes of the past year. Business this year has been amazing, with an ever-changing and challenging market. I have also been working on an exciting new analysis tool I hope to bring to market in 2019. As for my personal life, I am blessed to have great health and am surrounded by my loved ones.
If you haven’t seen or heard from me in the past few weeks, I’ve momentarily stepped away from the mortgage appraisal business. With the devastating fires affecting Butte County, I’ve been hired by insurance companies to complete disaster appraisals in Paradise, Magalia, and Chico. As of this blog post I’ve valued over $8.1 M in improvements for the community. This community needs all the help they can get. 153,336 acres were burned destroying 13,972 residences, 528 commercial structures, and 4,293 other buildings. If you are looking for great organizations to donate to this holiday season, I recommend the North Valley Community Foundation Camp Fire Relief (click for link), the Aaron Rodgers Norcal Fire Recovery Fund, and the North Valley Animal Disaster Group. The disaster appraisals have kept me very busy but I expect to be back doing mortgage-related appraisals at the beginning of 2019.
Who needs an appraisal anyway?
There is a current proposal from the FDIC, Federal Reserve, and Treasury Department which if passed, would NOT require appraisals for some mortgages under $400,000. While I may be slightly biased, as I do make my living by appraising properties, this change would impact everyone. If appraisals are removed from lending, numerous loans would be made that shouldn’t be. If we thought that stated income loans in 2008 were a bad idea, giving a loan without an accurate valuation of collateral is even worse. The US taxpayer will again be on the hook to bail out those institutions that make bad loans. The appraiser is typically the only person in a lending transaction that has no skin in the game. When I complete an appraisal in Grass Valley or Nevada City, I am giving my honest opinion of what it would sell for regardless of the price agreed upon by the buyer and seller. A realtor makes a commission on a percentage of the sales price and a mortgage broker only gets paid if they fund a loan. An appraiser is the only analyst in the transaction that is completely unbiased. I highly urge you to sign a change.org petition that my good friend Ryan Lundquist started, author of the nationally recognized sacramentoappraisalblog.com, and is sending to the FDIC, Federal Reserve, United States Department of the Treasury and President Donald J Trump.
I’ll have a large market update in early January 2019 where I analyze how the number of sales has changed in specific price groups since the bottom of the market. I’ll also be updating all of the areas in Nevada County, California appraisal blog.
Again, I wish you the happiest of holidays this season and a prosperous new year!

Predicting the Future - Part 2
The Magic 8 Ball
Fortune Cookies, Tarot Cards, Ouija Boards, and Magic 8 Balls all make the promise of telling the future. If I were a Magic 8 Ball and someone asked what the future of the Nevada County housing market looks like, my response might be ‘Focus and Ask Again’ or ‘We Better Wait and See.’
In Part 1 of the series, we took a look at basic economic theory of how prices worked; the effect of supply and demand. And based on current supply and demand, the Nevada County housing market has remained strong, with a limited supply and high demand. In my daily appraisals in Grass Valley and Nevada City, I continue to pay close attention to months of inventory and marketing times. For Part 2, I will analyze factors that affect supply and demand, namely unemployment, interest rates and recessions.
Unemployment
Living without steady employment can affect one’s ability to pay for the most basic needs- food, clothing, shelter etc. It is no surprise, therefore, that the unemployment rate has an effect on the housing market. We can see this firsthand by analyzing unemployment and housing during the past few recessions since 1990.

Nevada County’s unemployment rate peaked at 12.2% at the beginning of 2010. This was immediately following the recession of 2008-2009 (A recession is technically defined as a fall in Gross Domestic Product in two successive quarters). During that recession, unemployment jumped from 5.2% to 10.6% in Nevada County. Unemployment also jumped during the recession in the early 1990’s in Nevada County. The brief dot-com bubble and 9/11 recession in 2001 only slightly impacted Nevada County.

The Civilian Labor Force (defined as the sum of employed and unemployed non-military citizens over the age of 16) in Nevada County had been growing steadily until the 2008-2009 recession. Unemployment jumped and the labor force shrunk due to forced retirement and relocation.

As unemployment began to rise in 2007, immediately so did distressed sales (foreclosures and short sales). At its peak in February 2011, distressed sales accounted for 65.3% of sales in Nevada County when the unemployment rate was 11.7%.
Unemployment adversely affects both supply and demand. If someone doesn’t have a job, they most likely aren’t in the market to buy a new home, which decreases demand. Also, if someone is unemployed and can’t pay their mortgage, they may have to short sell or face foreclosure. This increases the supply of homes on the market. Much of the cause for the distressed sales and recession of 2008-2009 was directly impacted by unemployment.
Currently, Nevada County has a very low unemployment rate. If unemployment starts to rise, we can expect to see slowing demand and potentially rising supply in the housing market.
Interest Rates
Today there are many different types of interest rates and they all fluctuate. Most revolve around the Federal Funds Rate which is the rate at which banks borrow money from the Federal Reserve (aka The Fed). The Fed manipulates the Federal Funds Rate as one of the many tools they have to control the economy. Typically the Federal Funds Rate stays low for an extended time period after a recession as a way to jump start the economy, making it easier for banks (and people) to borrow money. Interest rates have risen slightly in the past year but historically remain quite low.

However, from 2004 - 2006 Adjustable Rate Mortgages (ARM’s) accounted for approximately 50% of all loan volume. While each individual ARM worked slightly differently, most had a low introductory rate that would change to an adjusted rate in a certain time period. If you obtained a 5/1 ARM in 2005, you may have had a fixed introductory rate of 2% for the first 5 years. However, in 2010, that interest rate would have suddenly adjusted to 7 or 8%. If you had a $400,000 loan, your payment could go from $1,450 to $2,800 in one month. Combine that with the possibility you may have lost your job, and you’d be forced to either short sell your home or go through foreclosure. Luckily, ARM’s account for very little of the current market. We can now analyze how these types of mortgages have influenced housing supply and demand over the last decade or so.
Yield Curve
I recently attended a seminar with Mark Zandi, Chief Economist of Moody’s Analytics. The seminar focused on the current and future state of the US economy and housing market. Zandi talked about analyzing the yield curve to help predict recessions. A yield curve plots interest rates of bonds that have different maturity rates.
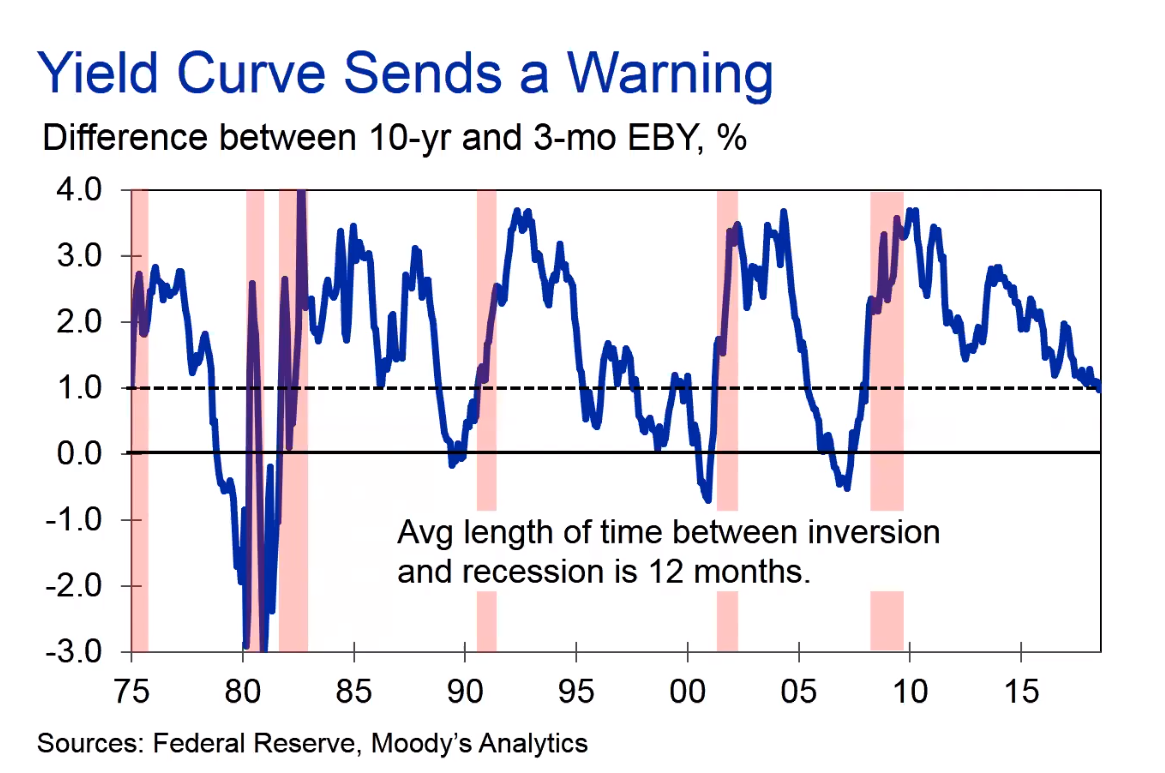
The yield curve (between 10 year and 3 month bonds) predicted recessions in 1980, 1981-1982, early 90’s, early 2000’s and in 2008-2009. Currently, this curve indicates there is little motive to invest in long term bonds. We are beginning to see the yield curve indicate a recession on the horizon. Zandi predicted the US would be in a recession by November 2020. You can read more about the yield curve theory at Forbes, Bloomberg and Jim Cramer of CNBC.

Speaking of Recessions…
How have previous recessions affected Nevada County’s housing market? The results are mixed. Monthly sales dipped slightly after the recession in 2001 but rebounded to almost an all-time high with 174 sales in June 2004. The recession of 2008-2009 brought some of the slowest months on record in January 2008 (38 Sales) and February 2009 (42 Sales).

The Housing Price Index for Nevada County shows that housing prices were unaffected by recessions in 1980 and the early 2000’s. Prices stagnated following recessions in 1981-1982 and the early 1990’s. The Great Recession of 2008-2009 was in the middle of a large decline in prices.

A closer look at individual sales show similar data that price trends were unaffected in the recession of the early 2000’s but significantly declined in 2008-2009.
What other Experts Are Saying …
“My take is that we may be in for slower rate of value growth in the next few years, depending on stability of state and national economies. Demand does not seem to be flagging, however, inventory is trending upward. Rising interest rates will also tend to hold down value growth. The current inventory of unsold homes includes an increased percentage of homes that have had price reductions.
My projection for the longer term is optimistic. Historical trends plus benefits I believe will accrue from improved high speed communications should affect a positive value trend in Nevada County.” -Charlie Brock, Grass Roots Coldwell Banker
“I feel we are seeing a correction in the market at the moment. Rates increasing can slow things down and can allow for the inventory to grow as it take some of the buying power out of the Buyers hands. We are also heading into the "slower season" of our market as the holidays are right around the corner. It will be interesting to see how 2019 handles rates, supply and demand. Spring will be a good indicator of how next year is going to go in my opinion.” -Jamie Barber, Network Real Estate
In Conclusion
The unemployment rate can influence the supply and demand of the housing market. Currently, the unemployment rate in Nevada County is near an all-time low at 3.4% but should be closely monitored for any significant changes. Interest rates are controlled by the Federal Reserve to boost the economy and stem inflation. Current interest rates have started to rise but remain near historic lows. The yield curve indicates the difference between short term and long term bond interest rates and can signal if a recession is on the horizon. The current yield curve indicates a recession in the near future but the impact on the Nevada County housing market is unknown. When I complete an appraisal in Nevada County, I always analyze each individual market to keep my finger on the pulse of supply and demand. At the same time, I keep my ears open to what’s happening on a national level and in neighboring markets to know if change is heading our way.

Predicting the Future - Part 1
My Crystal Ball
Oracles, seers, witches, psychics and mediums often have the gift of precognition. Noticeably absent from that group are real estate professionals. My crystal ball broke a really long time ago and I can’t seem to find anyone to fix it. It’s important to remember that no one has the ability to foresee what will happen in a real estate market. The best any analyst can do is study various economic indicators and potentially make an educated hypothesis. For the next series of blog posts, I will do just that: analyze the past, compare current conditions, and try to make sense of where the market is going.
For Part 1 of the series, it’s important to start with the basics. Economics 101 teaches basic economic principles; the most basic being supply and demand. It seems like a very simple concept: demand goes up and supply stays the same, then prices go up. Conversely, if demand stays the same and supply increases, prices will go down. This principle holds true whether we are talking about vegetables at the Nevada City Farmers Market or the housing market in Alta Sierra.
In a previous blog post (August 2018), I analyzed all sales in Nevada County since September 2000. It isn’t new to anyone that there was a market peak in early 2006 followed by a crash that bottomed out in 2012. The analysis showed that March 2006, specifically, was the month that values seemed to top out. Today, the overall Nevada County market has since recovered to near peak values.
Let’s look at three key factors of supply and demand within the Nevada County market: volume (Number of Sales and Listings), inventory (and overall marketing times) and prices.
2014-2018
The past four years the Nevada County market can be defined in three words: Hot, Hot, Hot!

Volume from 2014 - 2018 has been seasonally cyclical with slightly more new listings, followed by increased sales in the following months. Overall new listings and sales have been fairly stable indicating an average of 120 sales per month (county wide).

Inventory and marketing times have steadily decreased over the past four years. Marketing times tend to peak slightly higher in winter months and dip during summer months. Since March 2018 inventory has slightly risen from 2.2 to 4.1 months.

Median and Average Prices have risen steadily over the prior 4 years. There are slight dips in some winter months due to lower overall sales and lower priced homes sold during the winter. On average, the market has increased approx 8% per year increasing 32-37% over the full 4 year period.
2004-2008
Since values were at their highest at the beginning of 2006, it’s important to look at economic factors leading up to and after the peak.
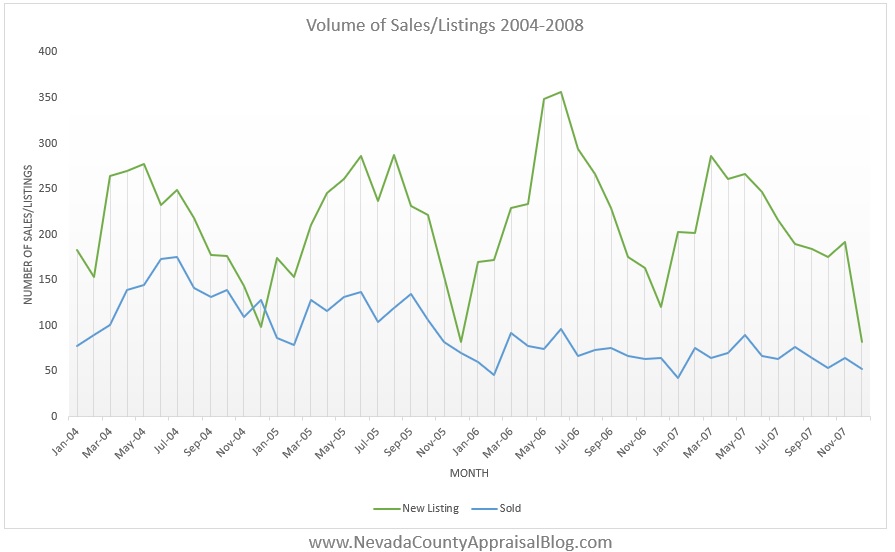
Listings were similarly cyclical with less homes being listed during winter months. Sales on the other hand were consistently declining over the entire four year period. Sales averaged 129 a month in 2004 and declined to 65 a month by the end of 2007. That’s a 50% decline in monthly sales over a 4 year time period. The number of listings also skyrocketed in 2006. From March to August, 1,730 homes were newly listed on the market. Compare that with 480 homes sold in that time period (80 sales per month). That equates to almost a 22 month supply of newly listed homes in just that 6 month time period. This is considered flooding the market.

Monthly inventory began to spike in September 2005 and marketing times began to increase at the exact same time. Monthly inventory went from 7.6 months in September 2005 to 28.5 months in January 2007. That is a 275% increase over 16 months. Average days on market rose from 44 days to 117 days over the same period, an increase of approximately 166%.

All of these indicators help to predict something according to basic economic principles. Increased inventory and marketing time (supply) combined with declining sales (demand) cause overall prices to decline. Median and average prices peaked from June 2005 - March 2006 and started their descent. Prices continued to decline until early 2012.
Then and Now
Does 2004-2008 compare to 2014-2018? More specifically, does the data from March - August 2006 correlate to March - August 2018? Is the sky falling?

In terms of volume there is one key difference: sales. Average sales per month have held strong in the current market averaging 136 sales per month. Sales are typically stronger during summer months. When values were peaking in 2006, June was the high sales month at 96. However, in June 2018 there were 164 sales.
The strong sales this summer have kept inventory relatively low- an average of 3.3 months. This is much lower than in 2006 when inventory was 15.9 months. Marketing times have also been considerably lower at 43.8 average days on market compared to 73 average days on market in 2006.
Average and Median sale prices are similar to what they were in 2006 (as we previously analyzed). The monthly average sold price is 94.7% of what it was in 2006 and the monthly median price is 98.8%.
In Conclusion - Part 1
Based on these basic supply and demand indicators, there’s no need to panic yet. Since values were the last indicator to change when the market crashed in 2006, there would be no reason for values to decline if there is a limited supply and high demand as there is now. One thing to closely monitor is a spike in inventory or slowing demand. This is reflective in the months of inventory and directly correlates to marketing times.
In Part 2 of this series, I’ll examine other economic indicators on a local and national level such as unemployment rate, labor force, interest rates and distressed sale percentages to see how they potentially impact either supply or demand of the local housing market.
The best we can do as real estate professionals is to be educated on past and current factors and clearly communicate them to our clients. If I’ve missed something or you’d like me to address something specifically please do not hesitate to ask. I can be reached at brian@snappraisal.com or by phone/text at 530-632-3428.

How to Handle the Heat
As summer turns to fall, the warm weather turns to brisk evenings and cool early mornings, many will look to flip on that thermostat, load the wood stove or even plug in a space heater. Modern times provide us with numerous ways to keep warm when it’s cold. Mortgagees, however, have certain criteria for heat sources and this can be a huge hurdle when trying to close a sale or obtain a refinance.
I’ve divided financing types into 4 basic groups to better understand the requirements for heat sources: Conventional, FHA, VA, and Cash or unique financing.
Conventional Financing
Typically, conventional financing loans must conform to the FNMA Selling Guide. Referring to heat sources, the selling guide states:
“The improvements should conform to the neighborhood in terms of age, type, design, and materials used for their construction. If there is market resistance to a property because its improvements are not compatible with the neighborhood or with the requirements of the competitive market because of adequacy of plumbing, heating, or electrical services; design; quality; size; condition; or any other reason directly related to market demand, the appraiser must address the impact to the value and marketability of the subject property.”
Simply put, the heat source, as with all of the improvements, needs to conform to the subject’s market. If a wood stove is common for the market, it would be acceptable. Typically, this is shown by including at least one comparable on the appraisal with a similar heat source. It may be helpful to the appraiser for a realtor to research and make sure there are similar sales with the same heat source as the subject.
FHA Financing
FHA has specific guidelines for Minimum Property Requirements (MPR’s) outlined in HUD Handbook 4000.1.
“The Appraiser must examine the heating system to determine if it is adequate for healthful and comfortable living conditions, regardless of design, fuel or heat source.
The Appraiser must notify the Mortgagee of the deficiency of MPR or MPS if the permanently installed heating system does not: 1) automatically heat the living areas of the house to a minimum of 50 degrees Fahrenheit in all GLAs, as well as in non-GLAs containing building or system components subject to failure or damage due to freezing; 2) provide healthful and comfortable heat or is not safe to operate; 3) rely upon a fuel source that is readily obtainable within the subject’s geographic area; 4) have market acceptance within the subject’s marketplace; and 5)operate without human intervention for extended periods of time.”
There is a lot to digest in these FHA guidelines. The heat source, just like FNMA, needs to be conforming to the market and run off a fuel source that is available within the local market. The heat source also has to automatically heat all living areas of the home to a minimum of 50 degrees without human intervention for an extended period of time. Although a wood stove may be cozy to snuggle up in front of, its not going to cut it as your sole heat source for an FHA loan. Nevada County does have many different types of heat fuels available including propane, heating oil, kerosene, and diesel.
VA Financing
VA also has a Lenders Handbook where Chapter 12 describes the Minimum Property Requirements (MPR’s).
“Heating must be adequate for healthful and comfortable living conditions. If the property has an unvented space heater, see the requirements in Section 11.12.
Homes with a wood burning stove as a primary heating source must also have a permanently installed conventional heating system that maintains a temperature of at least 50 degrees Fahrenheit in areas with plumbing.”
VA specifically mentions homes that have a wood stove as the primary heat source. These homes must also have a secondary heating system that heats the home to a minimum of 50 degrees where there is plumbing in the home. A cost effective wall heater can be permanently installed quite easily to satisfy this condition as long as it heats the area where there is plumbing. It is up to the analysis of the assigned VA appraiser to determine if the heat source is applicable for these areas.
Cash and Other Financing
Cash is King! Cash and other financing such as private lender and owner financing typically do not have specific guidelines on heat sources. It’s always best to check with the loan officer to see if the specific lender has any additional requirements.
Types of Financing in Nevada County
The types of financing have been pretty consistent within Nevada County in 2017 and 2018.

Examples
Here are some of the most common heat source examples found within Nevada County.

Forced Air Heating System
This is the most common heating system found, and would qualify for all types of financing.

Wall Furnace
Commonly found in older homes without cooling systems, a wall furnace would also qualify for all types of financing

Split System Heat Pumps
This is one of the newer types of heating and cooling systems. It has a compressor/condenser on the exterior of the home and individual air handlers on the interior which cycles and distributes the air. Split Systems qualify for all types of financing
Pellet Stoves
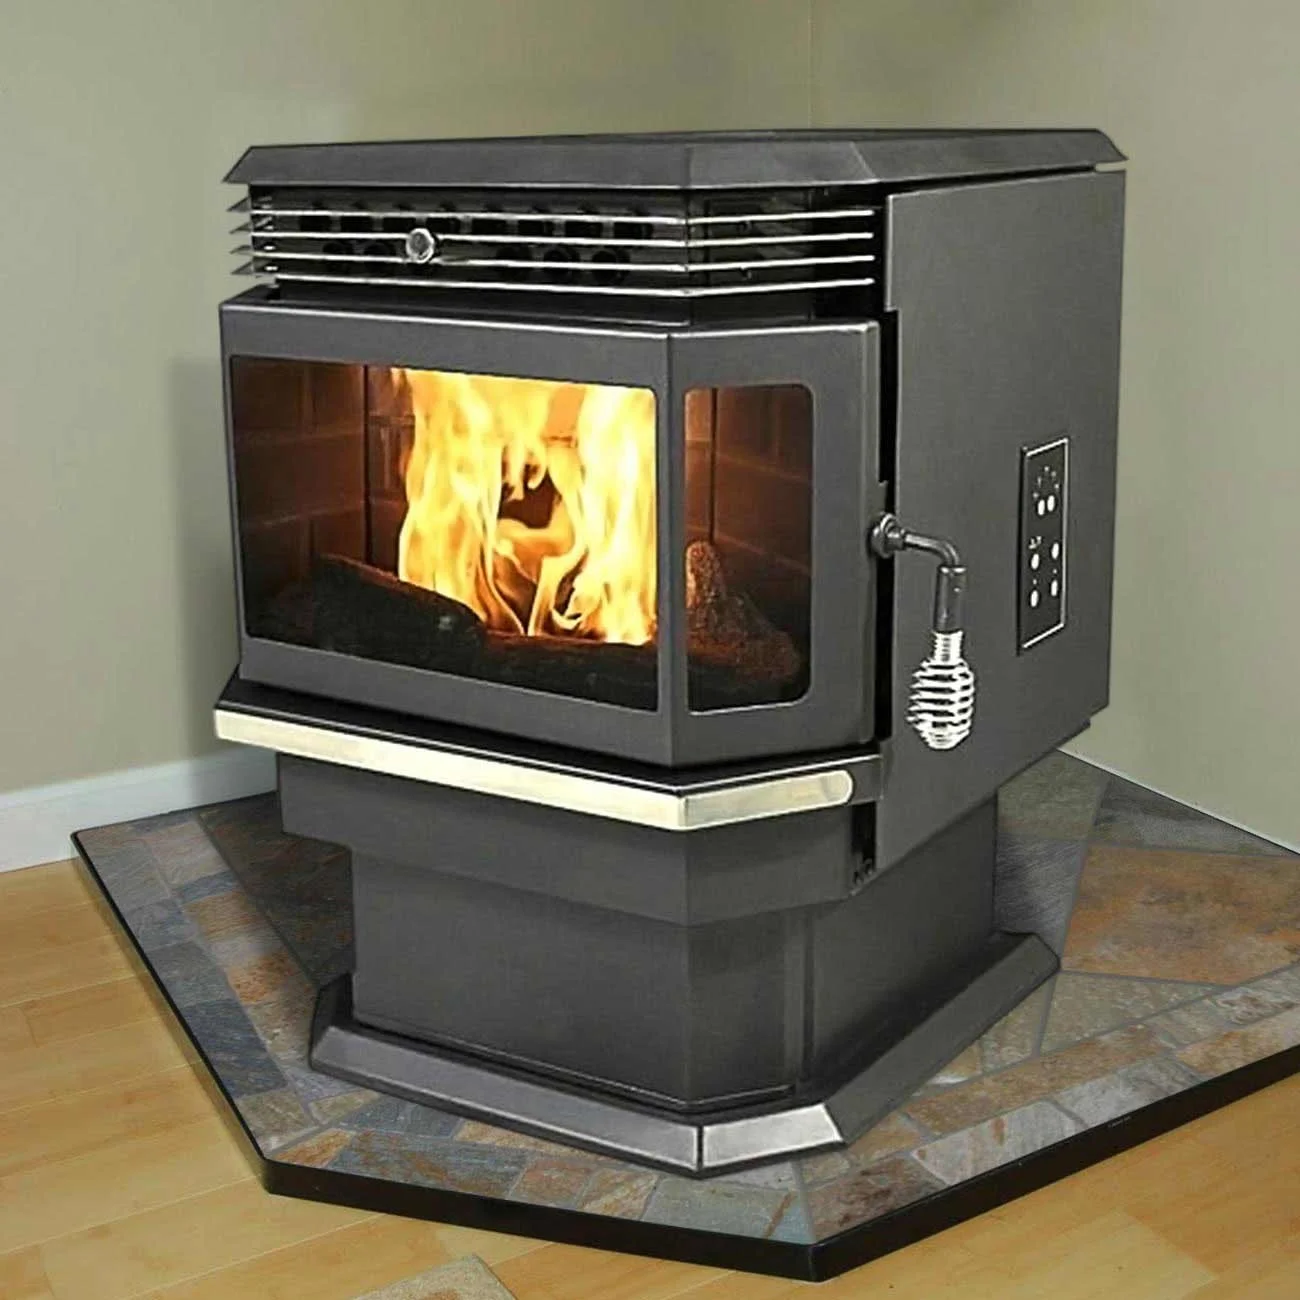
Pellet stoves typically have a reservoir of small wood pellets that are automatically released and used as fuel for the stove. Pellet stoves can have thermostats and typically last for 1-2 days before having to be refilled. I’ve contacted both VA and FHA, and as long as the reservoir will last for 1-2 days without having to be refilled, a pellet stove adheres to MPR’s. Pellet Stoves also satisfy FNMA heating requirements in Nevada County.

Radiant Floor Heating System
Typically Hot Water flows through the floors and heat rises to warm the home. It feels wonderful on the feet. It’s also very common for electrical radiant heat coils to be installed in bathrooms. Radiant Heat systems qualify for all types of financing.

Wood Stove
Since wood stoves require human intervention and do not automatically heat the home to a minimum temperature, they do not qualify as the sole heat source for FHA or VA. As long as they are typical within the market, a wood stove is an acceptable heat source for FNMA.

Propane or Natural Gas Stoves
They may look exactly like their cousin, the wood stove, but propane or natural gas stoves are thermostatically regulated and can be operated as long as there is a gas supply. They qualify for all types of financing as long as the stove is manufactured to heat the living area of the home.

Electric Wall Heaters
Because most electric wall heaters are quite cost effective, they are the most common heat source installed during escrow to satisfy financing requirements. Things to remember: The heaters must be hard wired into the electrical system and considered a fixture of the home. For FHA loans, the heater (or multiple heaters) must have a manufacturer rating sufficient to heat the entire Gross Living Area (and non-GLA areas containing building components) to a minimum 50 degrees. For VA loans, the heater must have a manufacturer rating sufficient to heat the areas of the home only with plumbing (if there is also wood stove or fireplace) to 50 degrees.

Space Heaters
Space Heaters come in all shapes and sizes but if they are not affixed to the home (permanently attached) they are considered personal property and do not qualify as a heat source.
In Conclusion
There are several compliant and non-compliant heat sources for various types of financing. During the appraisal observation the type of heating system will be analyzed and confirmed if it meets lending requirements. If there is any question on the heating source, it’s best to contact me or another local appraiser. I am FHA and VA certified and would be glad to offer my expertise before the appraisal.
Feel free to call or text 530-632-3428 or email me at brian@snappraisal.com. Stay Warm!

The Appraiser Coach Podcast
I was recently interviewed for The Appraiser Coach Podcast with Dustin Harris. If you'd like some insight into my appraiser world, have a listen.
http://theappraisercoach.libsyn.com/361-appraiser-stories-with-brian-melsheimer

Housing Data since 2000 in Nevada County
A friend of mine, Ryan Lundquist, recently analyzed the Sacramento housing market over the last 20 years in his Sacramento Appraisal Blog. This breakdown provides helpful and interesting insight into various Sacramento County markets. Ryan particularly notes when the peak and bottom of the market occurred, and what the recovery has been like. Inspired by this analysis, I thought it would be good to look at Nevada County as far back as the data in MLS goes, which is September 15, 2000. This should give a good outlook pre and post the Great Recession and how sales compare today. This can help homeowners realize how far the market has recovered if they are considering selling, refinancing or even obtaining an equity line.

Things to keep in Mind ...
It can be dangerous to interpret data trends and apply them to a specific market or subject property. If the monthly median sale price for all homes in Nevada County has increased 16% in the prior year it means just that; the middle sales price of the (on average 113) sales that month has increased 16% when comparing July 2017 to July 2018. If you look just one month back from June 2017 to June 2018 the data indicates a 5.5% increase. The moral of the story is that data itself can be misleading without analysis.
First lets look at every sale in the county since September 2000
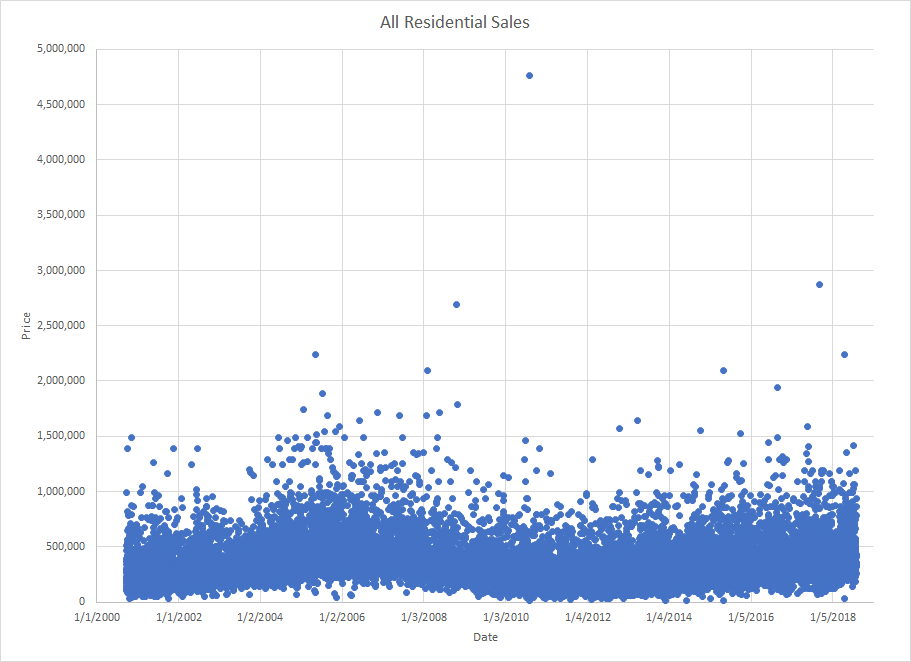
Looking at this chart tells me a few different things. Sales range from almost $0-$5,000,000 over the past 18 years which is a HUGE range. The data also shows that most sales are under $2,000,000. There appears to be a peak at the beginning of 2006 and a bottom in 2012.

Since most of the sales in the county are under $2,000,000, I've enlarged the graph and added a moving average trendline. This trendline indicates there was a peak in the market in early 2006 and the bottom of the market was in early 2012. The graph also shows on average, values are getting closer to the peak in 2006.

This is a 5th Order Polynomial Trendline I've chosen that best represents the trend. Don't be scared by the tail at the end, I've purposely told it to trend down at the end of the data. The trendline tells us the peak was in March 2006 with a value of $495,000. Current data along the trend and as of June 2018 shows we are at $455,000. This means the trend indicates values are currently about 92% of what they were at the peak.

The bulk of Grass Valley Sales are under $800,000 and indicate a peak trend value of $420,000 in March 2018 and are currently at $410,000. This indicates values are 98% of what they were at the peak.

In Nevada City, the trend value was $554,000 at the peak and currently at $510,000. This indicates values are 92% of what they were at the peak.
In Summary
Data shows the peak of the market was early 2006 and the bottom of the market was in 2012. This is not earth-shattering, as most real estate professionals knew this already. Nevada County has experienced quite a recovery from the bottom of the market in 2012. On average most homes are almost, but not quite, worth as much as they were at the peak of the market.
This data is great for an overall trend when speaking about the Nevada County market as a whole. As we all know, Nevada County has many different sub-markets and sub-markets of sub-markets. The market for an estate style home on Banner Mountain is different than an old miner's shack in downtown Grass Valley. When writing an appraisal, an appraiser will analyze the market for that specific subject property as well as overall general market trends. If you have questions on what the competitive market is doing for a specific property, it's always best to have an appraisal.
Be sure to check out the Nevada County, California market updates where I highlight the areas of Alta Sierra, Peardale/Chicago Park and North San Juan. There should be a market report for most markets in Nevada County. This shows a current 2 year analysis of the overall Nevada County market and a detailed 1 year analysis of the sub market.
If you ever have any questions or comments feel free to call/text me at (530) 632-3428 or by email at brian@snappraisal.com.
Multi-Family vs Accessory Dwelling Unit (ADU)
Archive note: This article reflects the information and market conditions available on its original publication date. Requirements and conditions may have changed. Confirm current guidance with the relevant authority before relying on the article for a present-day decision.
The Problem
"I have two houses on my property and I need to know what I have. Is this a duplex? Is this a guest house?"
I get asked this question at least once a week. It is an issue that often stumps homeowners, realtors, and lenders alike, and is one that doesn't always have an easy answer. Before I get into the confusion surrounding this topic, I'll clarify some definitions.
Accessory DWELLING Unit (ADU)
They have many names: granny unit, granny flat, guest unit, in-law unit, secondary dwelling, cottage, etc. Whatever you call it, it can be a great secondary space for renters, guests or family. An ADU is "a secondary dwelling unit with complete independent living facilities for one or more persons that can be attached or detached from the main home." ADU's are typically smaller in size than the main structure on the parcel and are usually allowable on parcels that are zoned for Single Family Residential. In Nevada County, "Accessory-Second Dwelling Units" are allowed on parcels within the R1, R2, R3, RA, AE, AG, FR and TPZ zoning districts. There are various standards, but in general, an ADU cannot exceed 1,200 sq ft of living space. The state of CA also has a classification of a Junior Accessory Dwelling Unit (JADU) in which the secondary dwelling does not have a kitchen. It's always best to check to see what the local jurisdiction allows for each parcel. The Nevada County Accessory-Second Dwelling Unit guidelines can be found at HERE. Further information from the State of California Department of Housing and Community Development can be found HERE.
Multi-Family
A multi-family residence typically refers to a duplex, triplex, fouplex, apartment building, etc. Think of a traditional duplex with two units side by side that are exactly the same. The few multi-family dwellings in Nevada County are typically located within the city limits of Grass Valley and Nevada City, and are specifically located in areas that are zoned for multi-family residences. In Grass Valley multi-family zoning is R-2, R-2A, R-2A-MH, R-3 and R-3-MH. In Nevada City, multi-family zoning is R-2. Both Grass Valley and Nevada City have historical districts which may allow for multiple uses including commercial or multi-family residences. I have included links to the zoning maps for Grass Valley and Nevada City.
The Confusion
The first thing I do when trying to classify additional living space on a property is look at the public records. There are numerous sources for public records including Realist, RealQuest, ParcelQuest, and title company searches. Realist is accessible through the Nevada County Association of Realtors MLS. Realist provides the lot size, square footage of the home, zoning, type, and land use.
If a property is a true duplex with two units side by side that are exactly alike, Realist reports the type as 'Duplex' and the land use as 'Multi-Res - Duplex/3-4 Units.' Seems easy. However, Realist will also report the same classification for all properties that simple feature an ADU. I recently received an order for a 3,000 sq ft main home located on a 4+ acre parcel with a 500 sq ft ADU. Realist types this as a duplex. This is where the confusion comes in.
The Answer
The answer ... as it always is in real estate ... it depends, usually on the location and zoning of the property. If the property is located outside the city limits, zoning only allows for Single Family Residential homes (plus an ADU). The planning department doesn't allow for true duplexes outside the city limits. If the subject is within the city limits of Grass Valley or Nevada City, however, you'll have to dig a little deeper. You'll need to check the zoning of the parcel to see what's allowable, but typically, if there is a larger home featuring a smaller secondary living space, its an ADU. If both units are similar in size (possibly attached to each other) and located in an area which allows for multi-family, it's probably a duplex or multi-family. The planning desks in Grass Valley and Nevada City are always great resources.
Bottom line, a concrete answer to this confusing issue can take some additional research. We live in a community where building started in the 1850's, long before incorporated cities, zoning codes and planning departments. Back then, landowners milled the wood and built wherever and whatever they saw fit. What makes this area's real estate so unique is what can make it difficult to assess.
I am always happy to assist with this issue or anything else related to Nevada County real estate. Be sure to check out the Nevada County Market Updates, this month I've highlighted the markets of Penn Valley, Rough and Ready and Smartsville/Big Oak Valley.
Call or text me at 530-632-3428.
The Problem
"I have two houses on my property and I need to know what I have. Is this a duplex? Is this a guest house?"
I get asked this question at least once a week. It is an issue that often stumps homeowners, realtors, and lenders alike, and is one that doesn't always have an easy answer. Before I get into the confusion surrounding this topic, I'll clarify some definitions.
Accessory DWELLING Unit (ADU)
They have many names: granny unit, granny flat, guest unit, in-law unit, secondary dwelling, cottage, etc. Whatever you call it, it can be a great secondary space for renters, guests or family. An ADU is "a secondary dwelling unit with complete independent living facilities for one or more persons that can be attached or detached from the main home." ADU's are typically smaller in size than the main structure on the parcel and are usually allowable on parcels that are zoned for Single Family Residential. In Nevada County, "Accessory-Second Dwelling Units" are allowed on parcels within the R1, R2, R3, RA, AE, AG, FR and TPZ zoning districts. There are various standards, but in general, an ADU cannot exceed 1,200 sq ft of living space. The state of CA also has a classification of a Junior Accessory Dwelling Unit (JADU) in which the secondary dwelling does not have a kitchen. It's always best to check to see what the local jurisdiction allows for each parcel. The Nevada County Accessory-Second Dwelling Unit guidelines can be found at HERE. Further information from the State of California Department of Housing and Community Development can be found HERE.
Multi-Family
A multi-family residence typically refers to a duplex, triplex, fourplex, apartment building, etc. Think of a traditional duplex with two units side by side that are exactly the same. The few multi-family dwellings in Nevada County are typically located within the city limits of Grass Valley and Nevada City, and are specifically located in areas that are zoned for multi-family residences. In Grass Valley multi-family zoning is R-2, R-2A, R-2A-MH, R-3 and R-3-MH. In Nevada City, multi-family zoning is R-2. Both Grass Valley and Nevada City have historical districts which may allow for multiple uses including commercial or multi-family residences. I have included links to the zoning maps for Grass Valley and Nevada City.
The Confusion
The first thing I do when trying to classify additional living space on a property is look at the public records. There are numerous sources for public records including Realist, RealQuest, ParcelQuest, and title company searches. Realist is accessible through the Nevada County Association of Realtors MLS. Realist provides the lot size, square footage of the home, zoning, type, and land use.
If a property is a true duplex with two units side by side that are exactly alike, Realist reports the type as 'Duplex' and the land use as 'Multi-Res - Duplex/3-4 Units.' Seems easy. However, Realist will also report the same classification for all properties that simply feature an ADU. I recently received an order for a 3,000 sq ft main home located on a 4+ acre parcel with a 500 sq ft ADU. Realist types this as a duplex. This is where the confusion comes in.
The Answer
The answer ... as it always is in real estate ... it depends, usually on the location and zoning of the property. If the property is located outside the city limits, zoning only allows for Single Family Residential homes (plus an ADU). The planning department doesn't allow for true duplexes outside the city limits. If the subject is within the city limits of Grass Valley or Nevada City, however, you'll have to dig a little deeper. You'll need to check the zoning of the parcel to see what's allowable, but typically, if there is a larger home featuring a smaller secondary living space, it’s an ADU. If both units are similar in size (possibly attached to each other) and located in an area which allows for multi-family, it's probably a duplex or multi-family. The planning desks in Grass Valley and Nevada City are always great resources.
Bottom line, a concrete answer to this confusing issue can take some additional research. We live in a community where building started in the 1850's, long before incorporated cities, zoning codes and planning departments. Back then, landowners milled the wood and built wherever and whatever they saw fit. What makes this area's real estate so unique is what can make it difficult to assess.
I am always happy to assist with this issue or anything else related to Nevada County real estate. Be sure to check out the Nevada County, California market updates, this month I've highlighted the markets of Penn Valley, Rough and Ready and Smartsville/Big Oak Valley.
Call or text me at 530-632-3428.
Size Matters
Archive note: This article reflects the information and market conditions available on its original publication date. Requirements and conditions may have changed. Confirm current guidance with the relevant authority before relying on the article for a present-day decision.
Size Matters
I suppose I should specify what I am talking about … in this case I’m referring to living space, square footage, or as appraisers refer to it, Gross Living Area (GLA). In my 15 years of appraising, one constant I’ve always found is there are endless opinions of what constitutes living space. Just last week I had a homeowner tell me her covered sidewalk was now being taxed as “living space” so it should be included in the living area of her home. I had to explain to her that there can be many types of living space, GLA, outdoor living space, guest living space, etc. And while these spaces MAY contribute to market value of a home, the main living area of the home is referred to as Gross Living Area and would not include the covered sidewalk space.
There are many different ways and standards on how to measure the GLA of a home. There are industry professional standards American Measurement Standard (AMS) and American National Standards Institute (ANSI). Most appraisers rely on their experience and how they were taught by their mentor. All of these methods and standards should come to a similar conclusion on what to value as living space of a home. The Dictionary of Real Estate Appraisal, 5th ed. defines GLA as the total area of finished, above grade residential space; calculated by measuring the outside perimeter of the structure and includes only finished, habitable, above-grade living space. I’d add that all living space must be accessible through the interior of the home. This concept may seem very simple but there are so many what if’s. I’ll cover a few different types of potential living areas.
Guest Units
Guest units are also known as granny units, guest quarters and accessory dwelling units. They can be attached or detached from the home; some have kitchens, some do not. If the guest unit is not accessible through the interior of the main home (such as through a hallway), this area is not considered GLA. It is extremely common for this area to be included in the reported in square footage on MLS or sometimes county records, however an appraiser will not include this area in GLA. This area should not be included in the reported square footage on MLS. I’d highly suggest to be clear in the property description the area is not included and estimate the area of the guest unit.

Barns and Workshops


Barns and workshops are typically detached from the home and may have some sort of living space above. Again this area is typically not accessible through the interior of the home and would not be considered GLA.
Enclosed Patios and Sunrooms
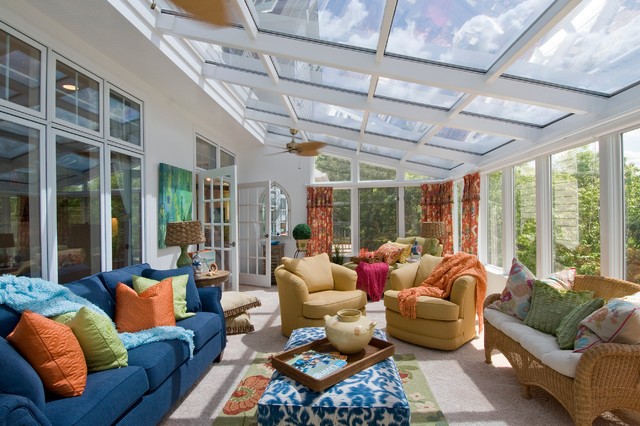

Enclosed patios and sunrooms typically are not heated and would not be considered part of GLA. If this area was heated was finished in a similar quality to the rest of the home, it could potentially be part of GLA.

Finished Basements and Attics
There aren’t too many true basements in Nevada County. Occasionally I’ll run into one in a Victorian home in downtown Grass Valley or Nevada City. A basement is considered a room below grade (ground level) and can be finished or unfinished. Basements are reported as area below grade and not as GLA. We also don’t see finished attics in Nevada County. I don’t think I’ve ever run across one if my career. Finished attics are not considered GLA
A-Frame Homes and Pitched Walls
In some areas an A-Frame house will have a second floor that extends to the roof. For rooms with pitched walls the minimum ceiling height for the area to be counted as GLA is 7ft (in the center). All area that have at least 5ft of ceiling height would be valued as GLA. (Check out my friend Ryan Lundquist’s blog post here http://sacramentoappraisalblog.com/2012/07/10/how-low-can-a-ceiling-be-before-its-not-considered-square-footage/ )


What I call ... 'Lower Levels'
Being located in the foothills it is extremely common to enter homes on the street level and have the home extend down to a lower level along the slope of the land. In fact, my own home has this design. Technically if more than 1 ft is below grade on any side of the home, that entire floor is considered below grade (per ANSI). In the Nevada County market these lower levels are typically included in GLA and reported as living area within the local MLS. Most buyers perceive this type of area as living space. The Dictionary of Real Estate Appraisal’s definition of GLA states that ‘local practices may differ.’ The FNMA selling even specifically states “For example, a property built into the side of a hill where the lower level is significantly out of ground, the interior finish is equal throughout the house, and the flow and function of the layout is accepted by the local market, may require the gross living area to include both levels.” I almost always include the lower level of a home in the GLA as long as there is interior access, is heated and was constructed with similar quality as the rest of the home.
What really matters … valuation
When it comes down to the market value of a home the appraiser is really trying to determine the markets’ reaction to individual categories or features such as site size, view, quality, condition, GLA, guest units, basements, barns, etc. This market reaction is dependent on the comparables found on MLS and the accuracy of the data entered for such features. Its important to compare apples to apples, GLA to GLA and guest units to guest units.
If a home has multiple types of areas its best to report the GLA as living space and then breakdown any additional areas in the property description. Pricing a home works the same way. A buyer for a 2,200 sf home that has a 1,000 sf guest house is going to be willing to pay for a 2,200 sf home with a guest house. This number typically isn’t the same as a buyer that is willing to pay for a 3,200 sf home. There is some typically some diminishing returns to scale for the other living area. That’s why it’s imperative to advertise the home correctly in the MLS listing.
Measuring a home can be simple, but also can throw some curveballs. Most local appraisers would be glad to come measure a home for a minimal charge. If you ever have any questions about areas of a home and how they might be ‘counted’ call or text me at 530-632-3428 or email me at brian@snappraisal.com.
Welcome to the Nevada County Appraisal Blog!
Welcome to the Nevada County Appraisal Blog: an informative space covering real estate and appraisals in the Western Nevada County region. My name is Brian Melsheimer, I am the founder and residential real estate appraiser at Sierra Nevada Appraisal Group. Since starting my business in 2008, I have become increasingly interested in the nuances and complexities of the Nevada County real estate market. Anyone familiar with the area knows that between subdivisions like Lake Wildwood, to gold-rush era Victorians, homes here are truly unique with values that reflect. Nevada County has been a beautiful place to live and an exciting place to appraise.
My family moved to the area when I was four years old. I grew up in Lake Wildwood, attending Pleasant Valley School and Nevada Union. After high school, I attended Sonoma State University where I graduated with a degree in Economics. Like most college graduates, I had student loans to pay; I needed permanent employment immediately. I turned to a friend who worked for a temp agency and after a few months of temping at various jobs, I was sent to World Savings Bank where I worked as an assistant to a Regional Appraisal Manager. After about a month of mundane tasks, I began to feel as though my hard-earned economics degree was going to waste. I was able to work out a deal with my manager stipulating that if I continued to schedule appointments for four more months, I would earn a permanent position as an appraiser trainee and would be able to work my way to becoming a certified appraiser. Finally, a promising job! But what did an appraiser actually do? Despite weeks of scheduling their inspections, I had little idea what appraisers did in the field. I did know, however, that they weren’t stuck in some office forty hours a week and they got a company car. As a twenty-two year old, this sounded great! Furthermore, I was excited to begin a career in something that seemed to be a good balance between using my analytical and communication skills.
World Savings had an extensive training department where I was able to learn one-on-one from my mentor. After eighteen months and two thousand hours of experience, I passed the state test, becoming a licensed Residential Appraiser (AL). Over the next three years, I elevated my license to a Certified Residential Appraiser (AR), eventually managing appraisal offices in Napa and Oakland.
In 2008, the Great Recession hit the mortgage industry hard. The appraisal department I had been employed with had been reduced from three thousand plus employees to a team of thirty. Unfortunately, I was one of the many people to go. However, soon after, I was approached by that same department about becoming a contract appraiser. I would be doing mostly pre-foreclosure, short sale, and foreclosure appraisals. This enabled me to move my work to South Lake Tahoe for a year, and eventually back to my hometown to begin a new chapter and new business as Sierra Nevada Appraisal Group.
From starting my career in the San Francisco Bay area to managing appraisals as far away as the Mississippi River, I have found appraising in gold country is unlike appraising in any other part of California or the United States. Nevada County is one of the few places I have encountered where there are no big builders – companies that, over time, build large developments of like homes. There are no cookie cutter, one-size-fits-all homes here. This has lead to market areas and sub market areas that may not necessarily compete. Nevada County properties offer unique features including panoramic foothill views, cascading ponds, meandering creeks, NID irrigation, historical barns, large metal workshops with car lifts and countless other custom upgrades. These features combined with the historical nature of much of Nevada County’s real estate makes this market extremely complex.
Despite Nevada County’s character and beauty, valuing homes here can be confusing and difficult. I’ve created this blog to offer guidance and clarity to everyone from homeowners weighing the decision to buy or sell to agents trying to advise clients on a proper price for a listing or making on offer. My goal is to educate local homeowners and real estate professionals about the appraisal process, industry news and current market conditions. Along with the Blog, I will be offering the Nevada County Market Update. Once a month, I’ll update the current trends of residential real estate on a macro level for all of Nevada County, as well as highlight one specific market. This month, the Update features Lake Wildwood and Lake of the Pines.
For order inquiries, I can be reached through the Contact Us tab on my website - snappraisal.com. If you’d like to request a topic for the blog or have a questions about anything appraisal related in Nevada County, please feel free to email me at brian@snappraisal.com or call/text me 530-632-3428. I am also currently a member of the Real Estate Appraisers Association (REAA) where I attend monthly continuing educational seminars.