
Nevada County Real Estate Market 2025 Recap
Market Continues Stabilization as Volume Recovers
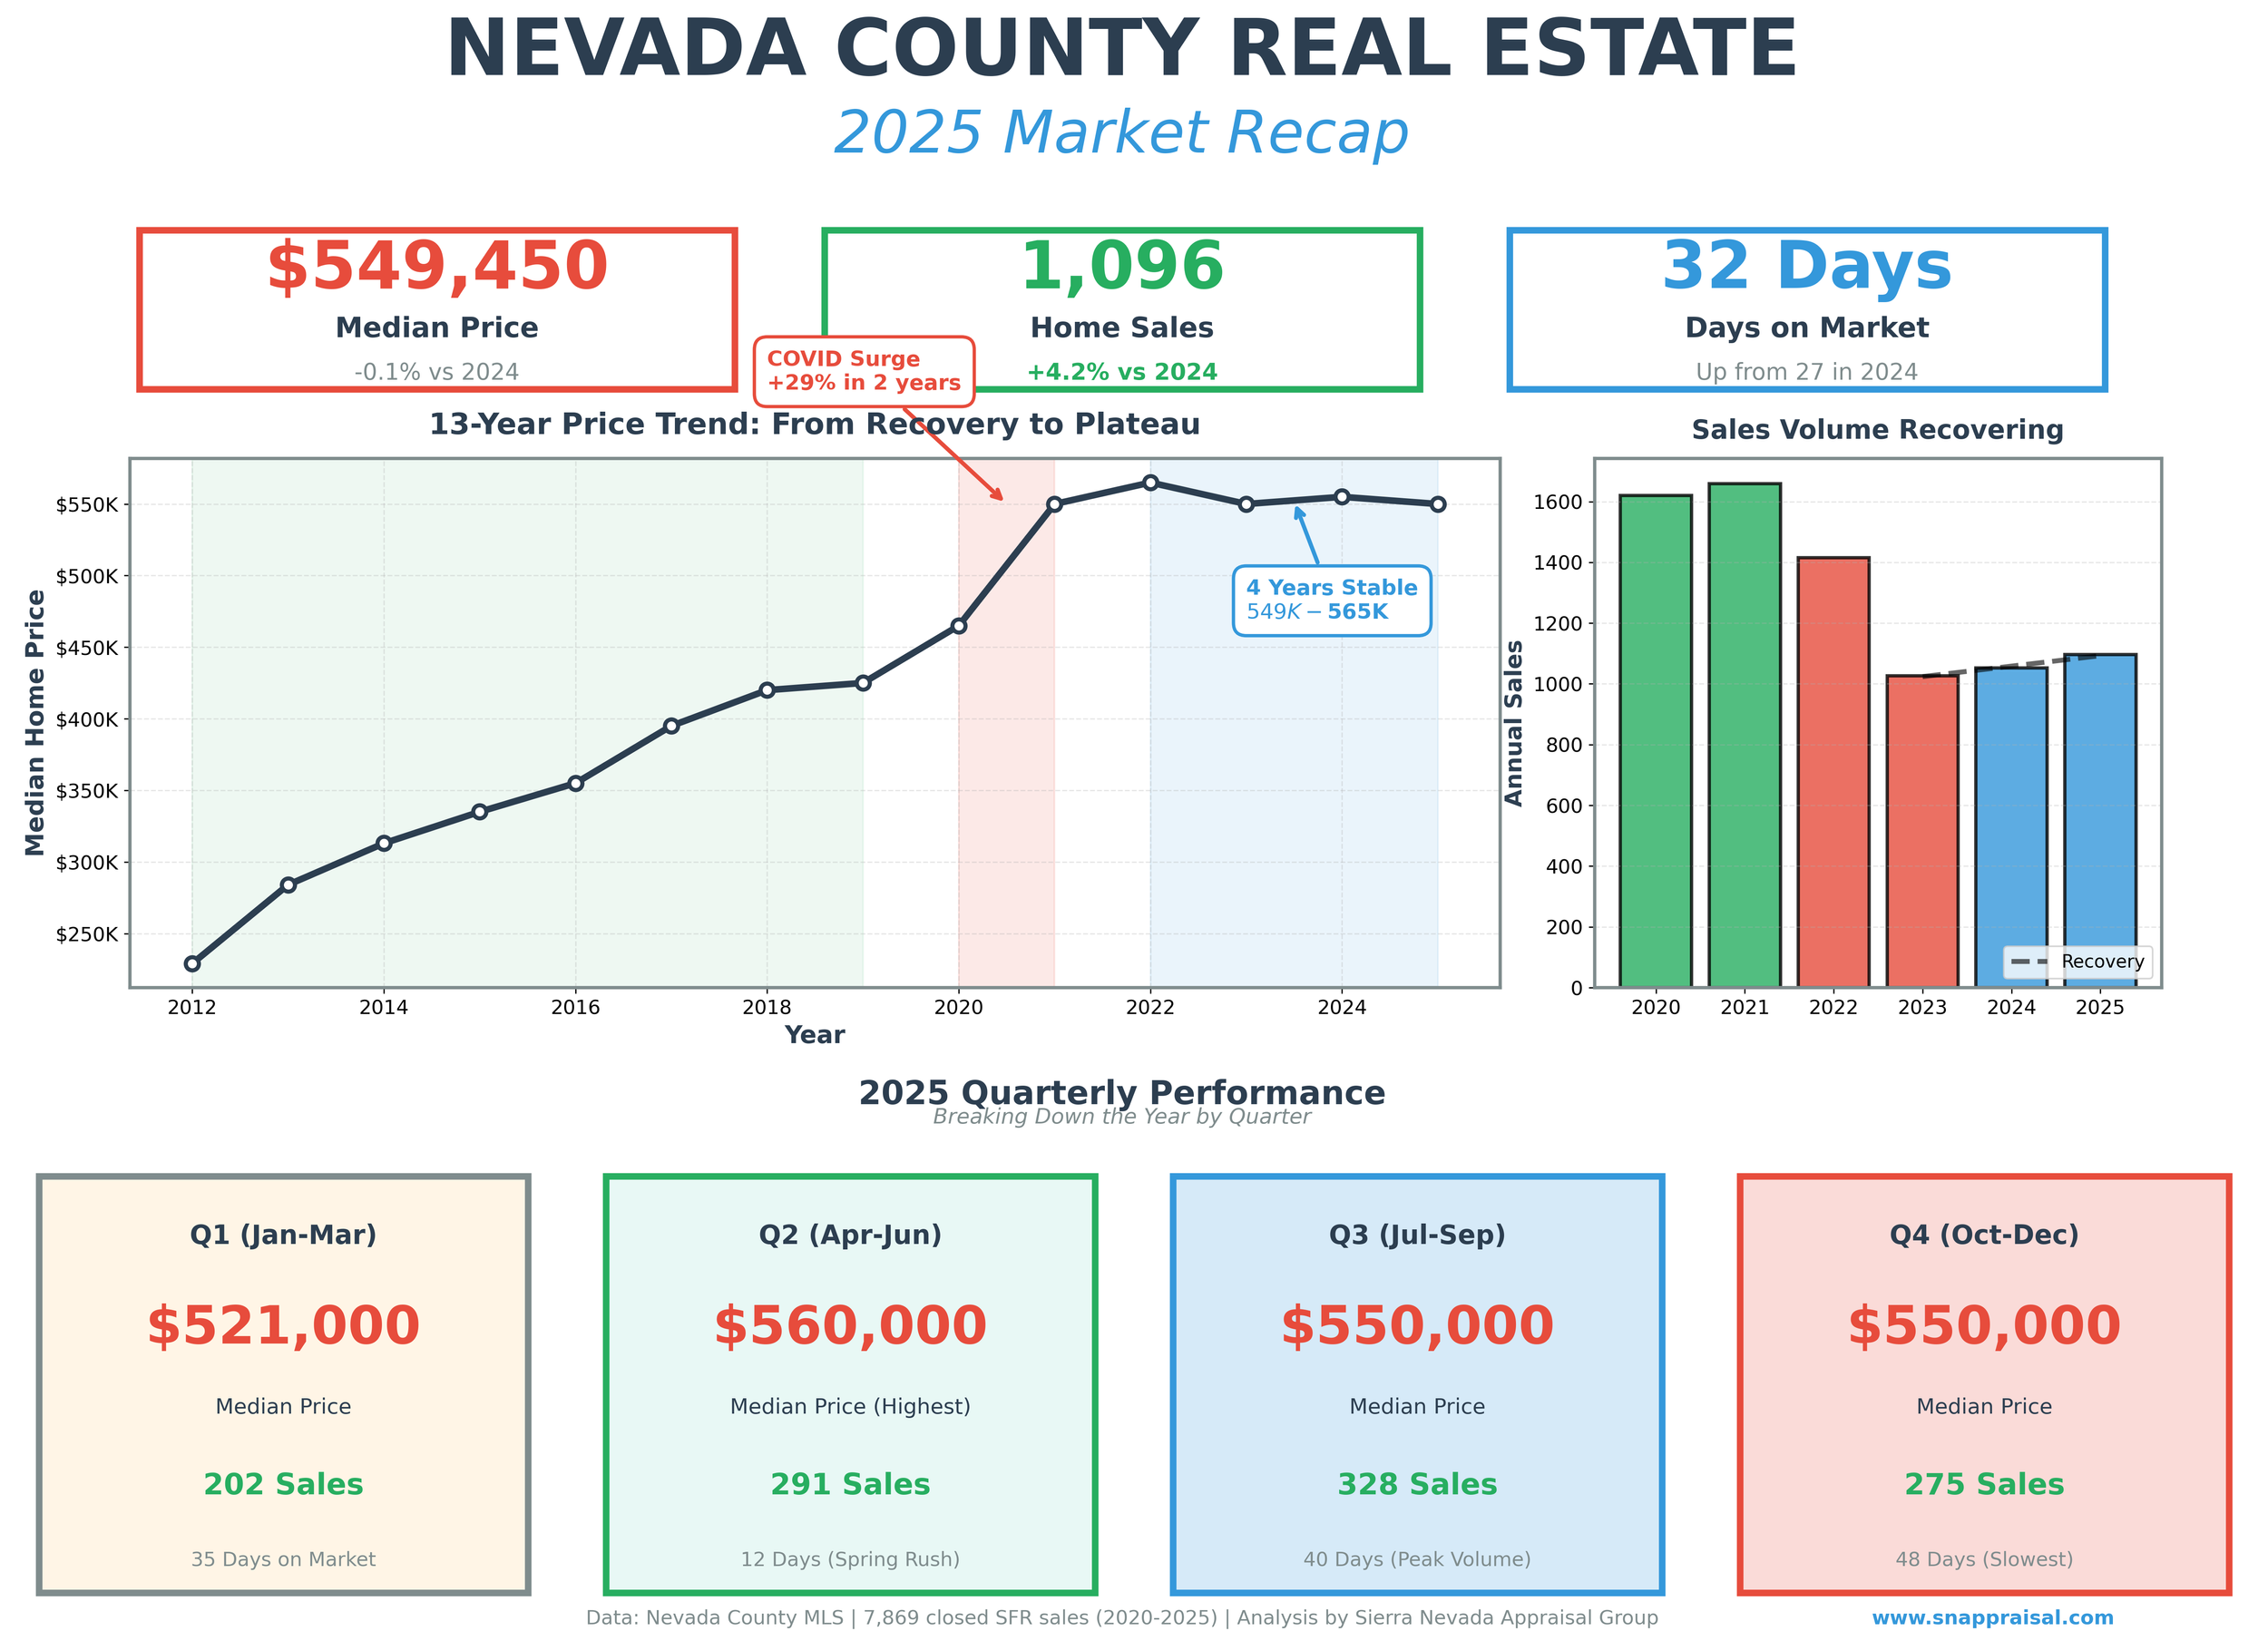
The Nevada County residential real estate market ended 2025 much as it began—stable prices near $550,000 and modestly improving sales activity. After the dramatic swings of the pandemic era and subsequent correction, the market has now settled into a multi-year pattern of price stability and gradually recovering transaction volume.
The Numbers
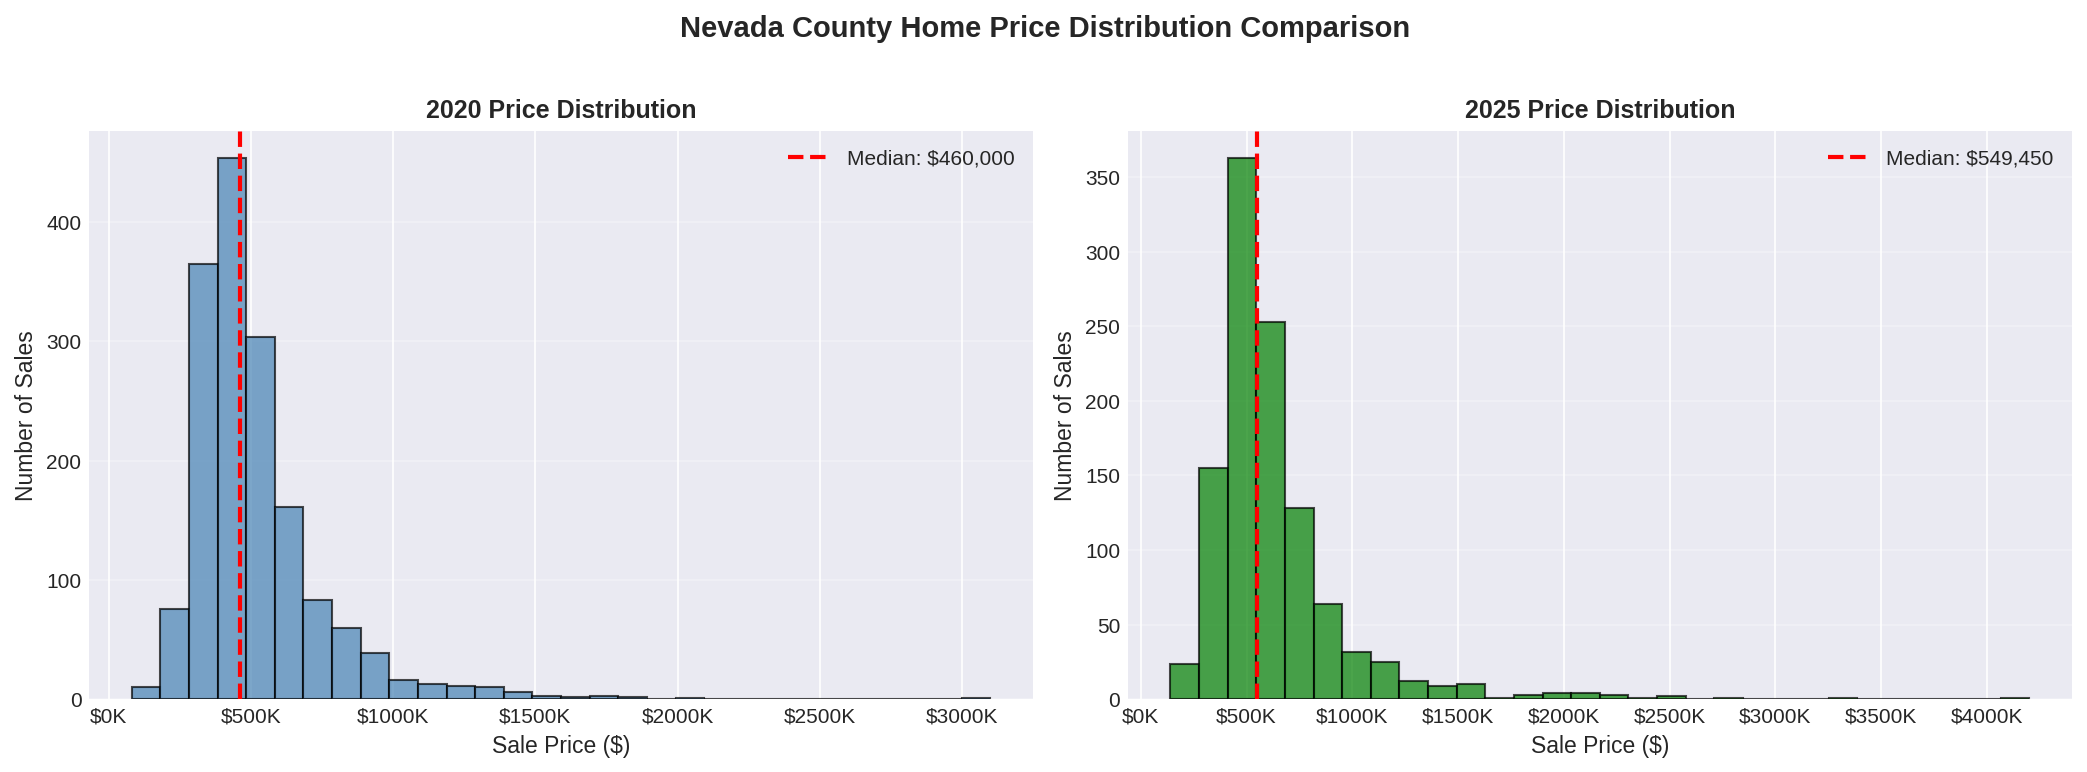
Median Home Price: $549,450
The median sale price for single-family homes in Nevada County ended 2025 at $549,450, essentially unchanged from 2024's $550,000 (-0.1%). This marks the third consecutive year of price stability following the post-pandemic correction:
2020-2021: +19.3% (pandemic boom)
2021-2022: +2.0% (peak)
2022-2023: -2.0% (correction begins)
2023-2024: +0.2% (stabilization)
2024-2025: -0.1% (continued stability)
While the market has cooled from its 2021-2022 peak, prices remain elevated compared to pre-pandemic levels. The current median of $549,450 represents a 19.4% increase from the 2020 median of $460,000—nearly all of which occurred in a single year (2021).
Sales Volume: 1,096 Transactions
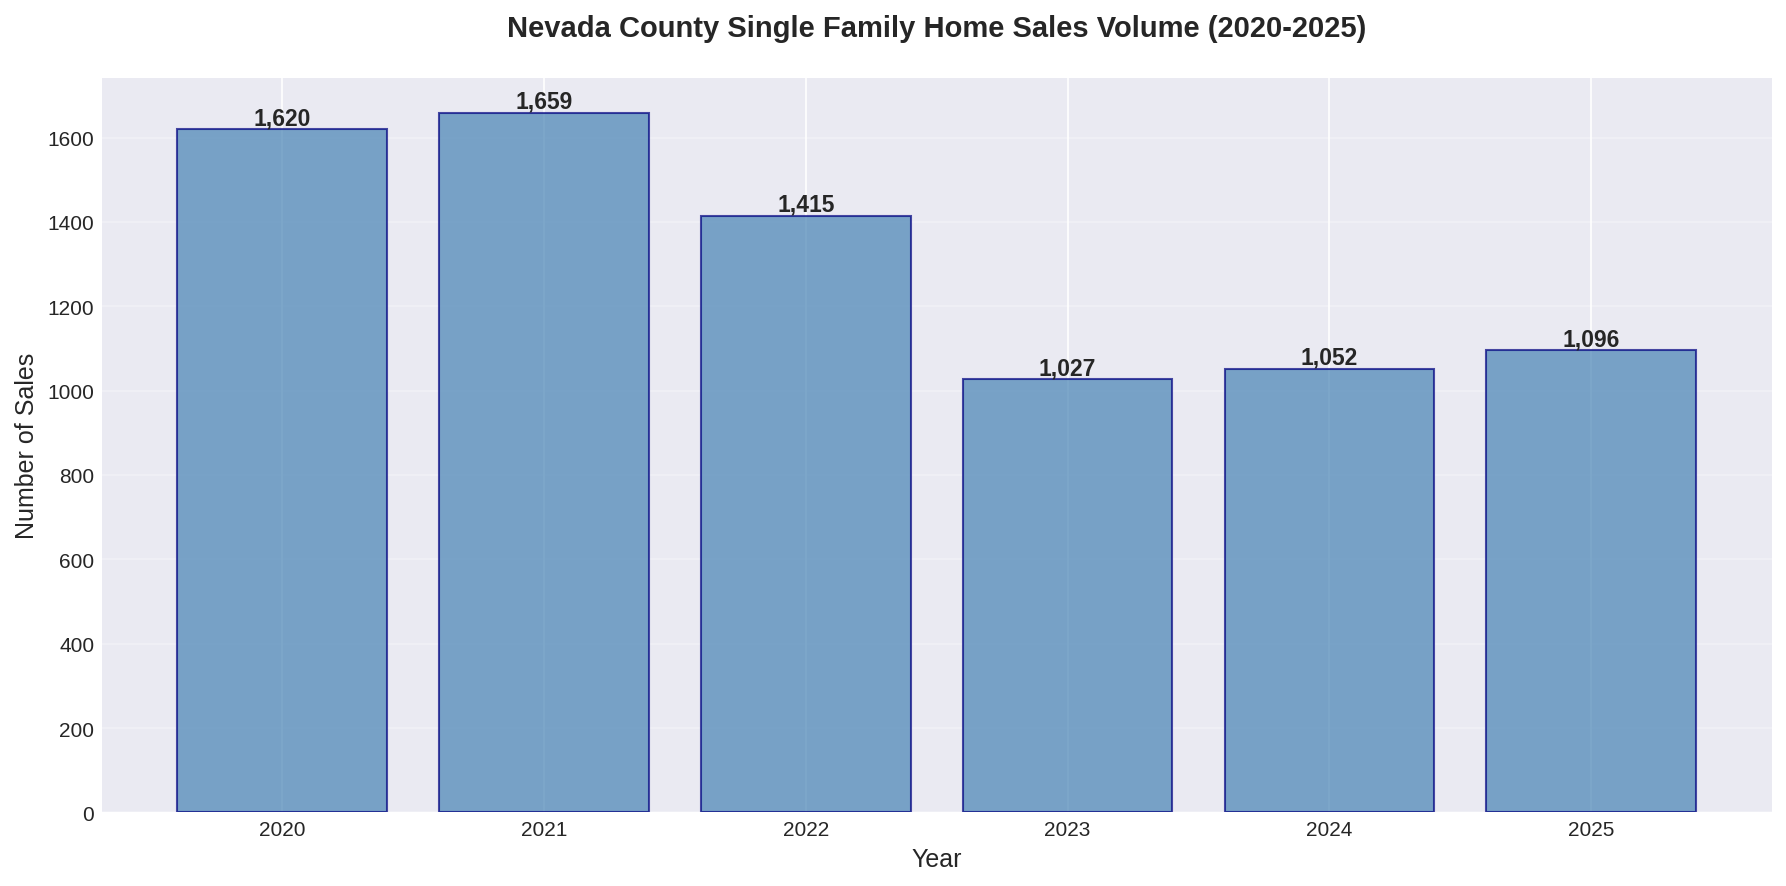
Transaction volume showed continued improvement in 2025, with 1,096 home sales compared to 1,052 in 2024—a 4.2% increase. This marks the second consecutive year of volume recovery, though we remain well below pandemic-era peaks:
2020: 1,620 sales
2021: 1,659 sales (peak)
2022: 1,415 sales (-14.7%)
2023: 1,027 sales (-27.4%)
2024: 1,052 sales (+2.4%)
2025: 1,096 sales (+4.2%)
The 2023 low point now appears to have been the bottom, with sales recovering modestly but steadily over the past two years. Still, 2025 volume remains 34% below the 2021 peak.
Looking at the Long-Term Trend (2012-2025)
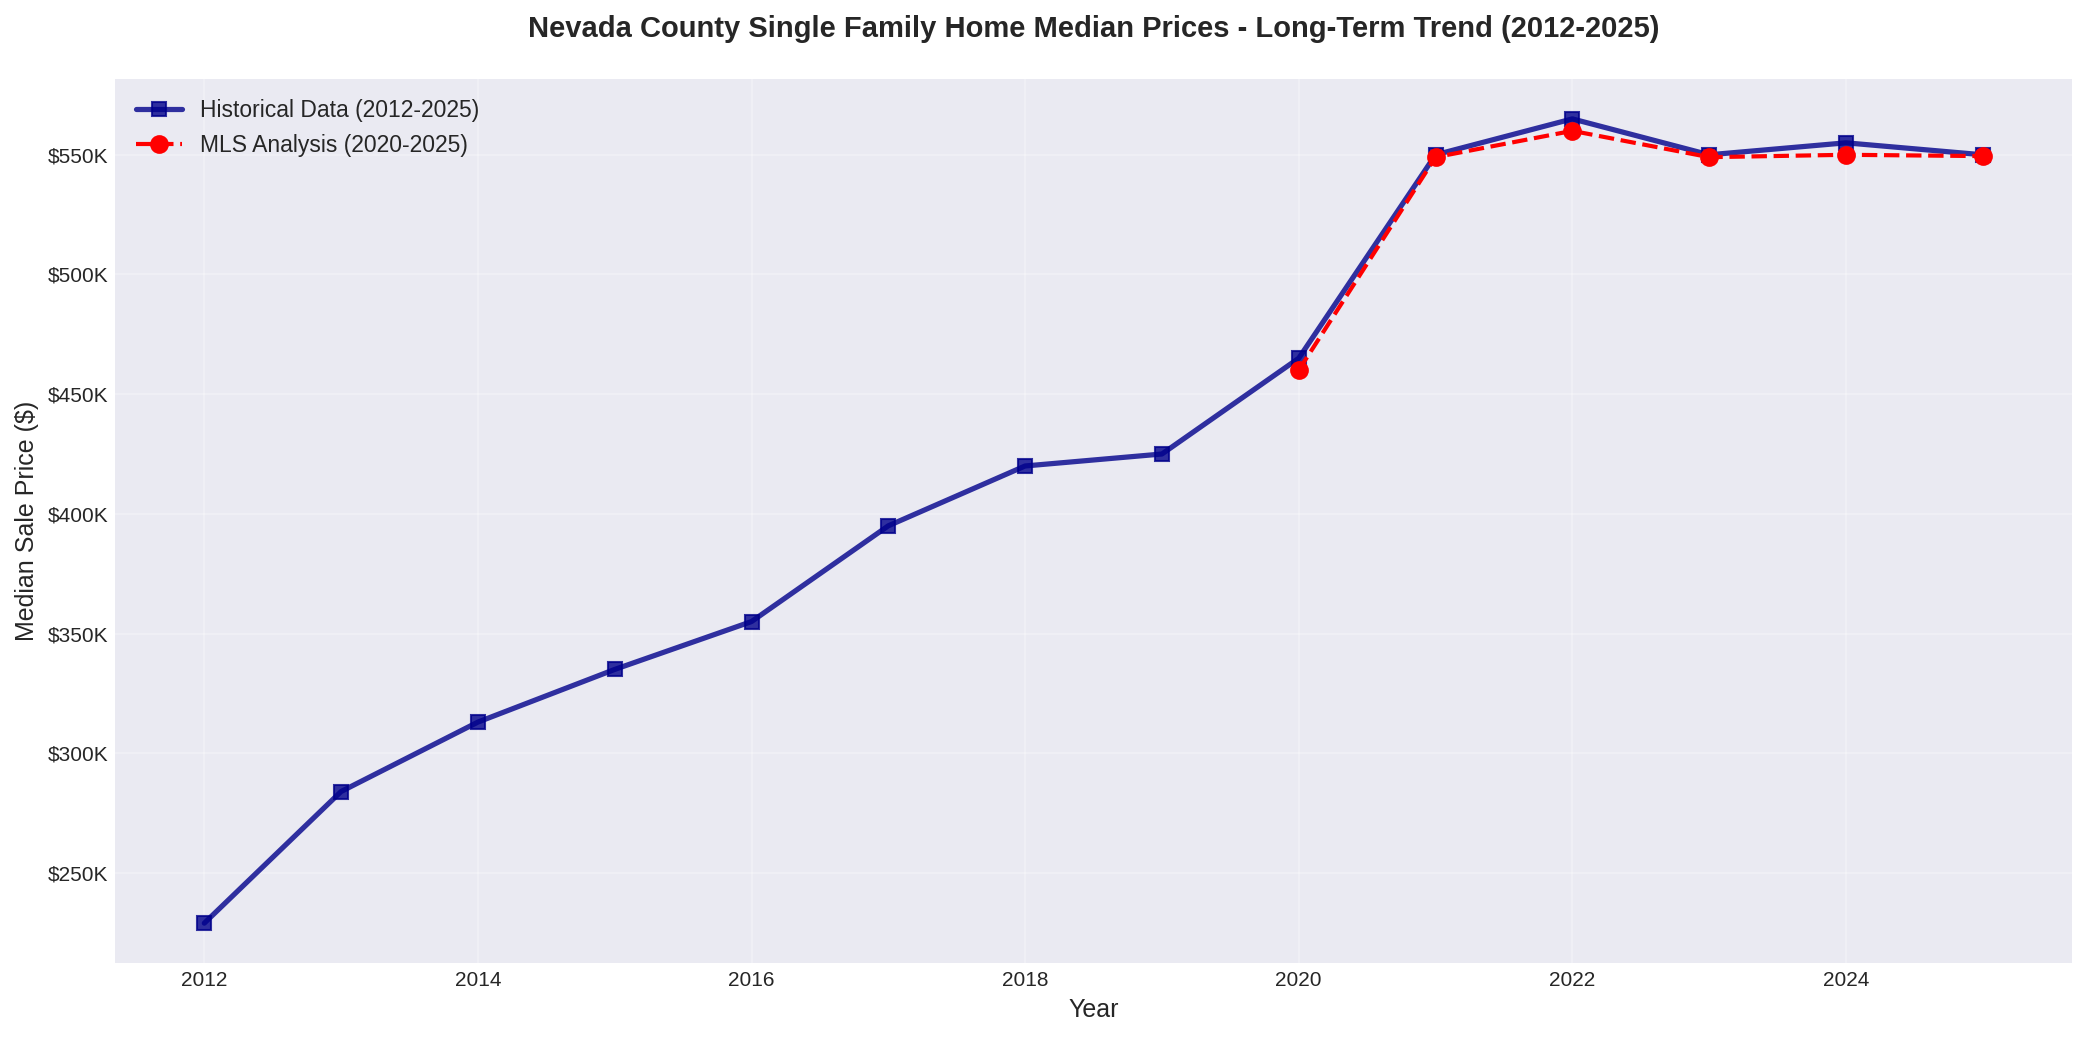
The 13-year view reveals Nevada County's complete market cycle:
2012-2019: Post-recession recovery, with median prices rising from $229,000 to $425,000—an 86% increase over seven years
2020-2021: Pandemic acceleration, with prices surging 29% in two years to $550,000
2022-2025: Extended plateau, with prices oscillating in a tight $549,000-$565,000 range for four years
From 2012 to 2025, Nevada County median home prices have increased 140%, from $229,000 to $549,450. Notably, the market has essentially moved sideways since 2022—a four-year period of stability unprecedented in the post-recession era.
Market Dynamics
Days on Market
Homes took longer to sell in 2025, with median Days on Market increasing to 32 days, up from 27 in 2024 and continuing a multi-year trend away from pandemic-era speed. For context:
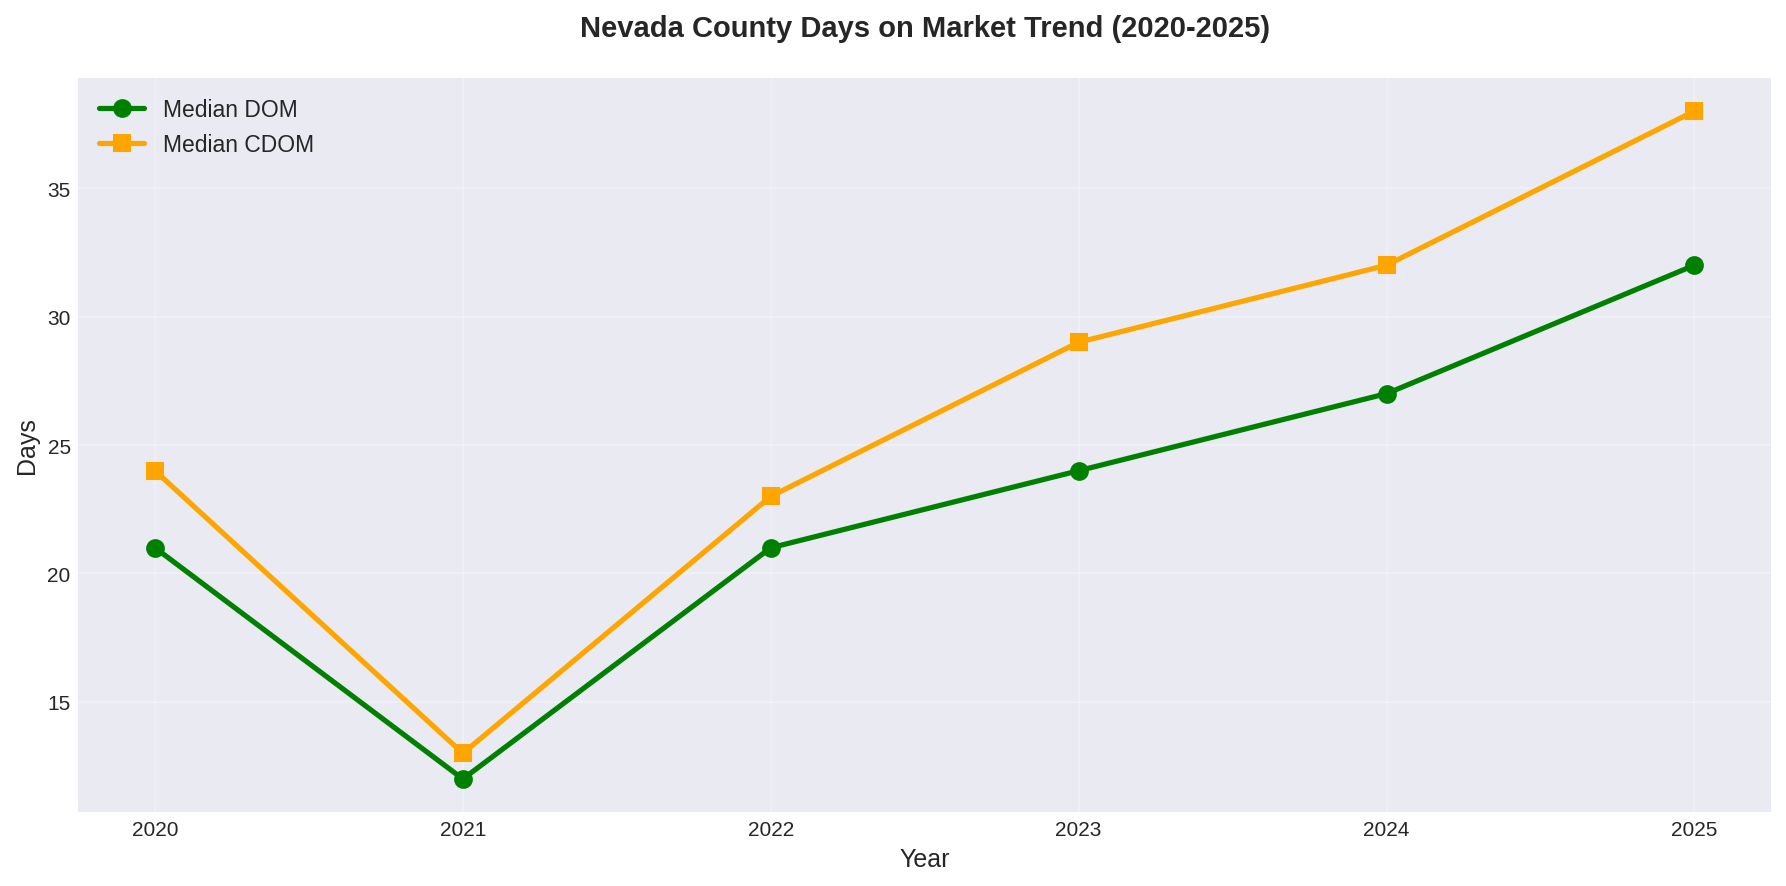
2021: 12 days (peak urgency)
2022: 21 days
2023: 24 days
2024: 27 days
2025: 32 days
The quarterly data shows pronounced seasonality:
Q1 2025: 35 days
Q2 2025: 12 days (spring rush remains strong)
Q3 2025: 40 days
Q4 2025: 48 days (slowest quarter)
Price Per Square Foot
The median price per square foot declined slightly to $305 in 2025, down from $306 in 2024 and $313 at the 2022 peak. This metric has now declined or held flat for three consecutive years after the rapid pandemic-era escalation ($248 in 2020 → $313 in 2022).
Quarterly Performance
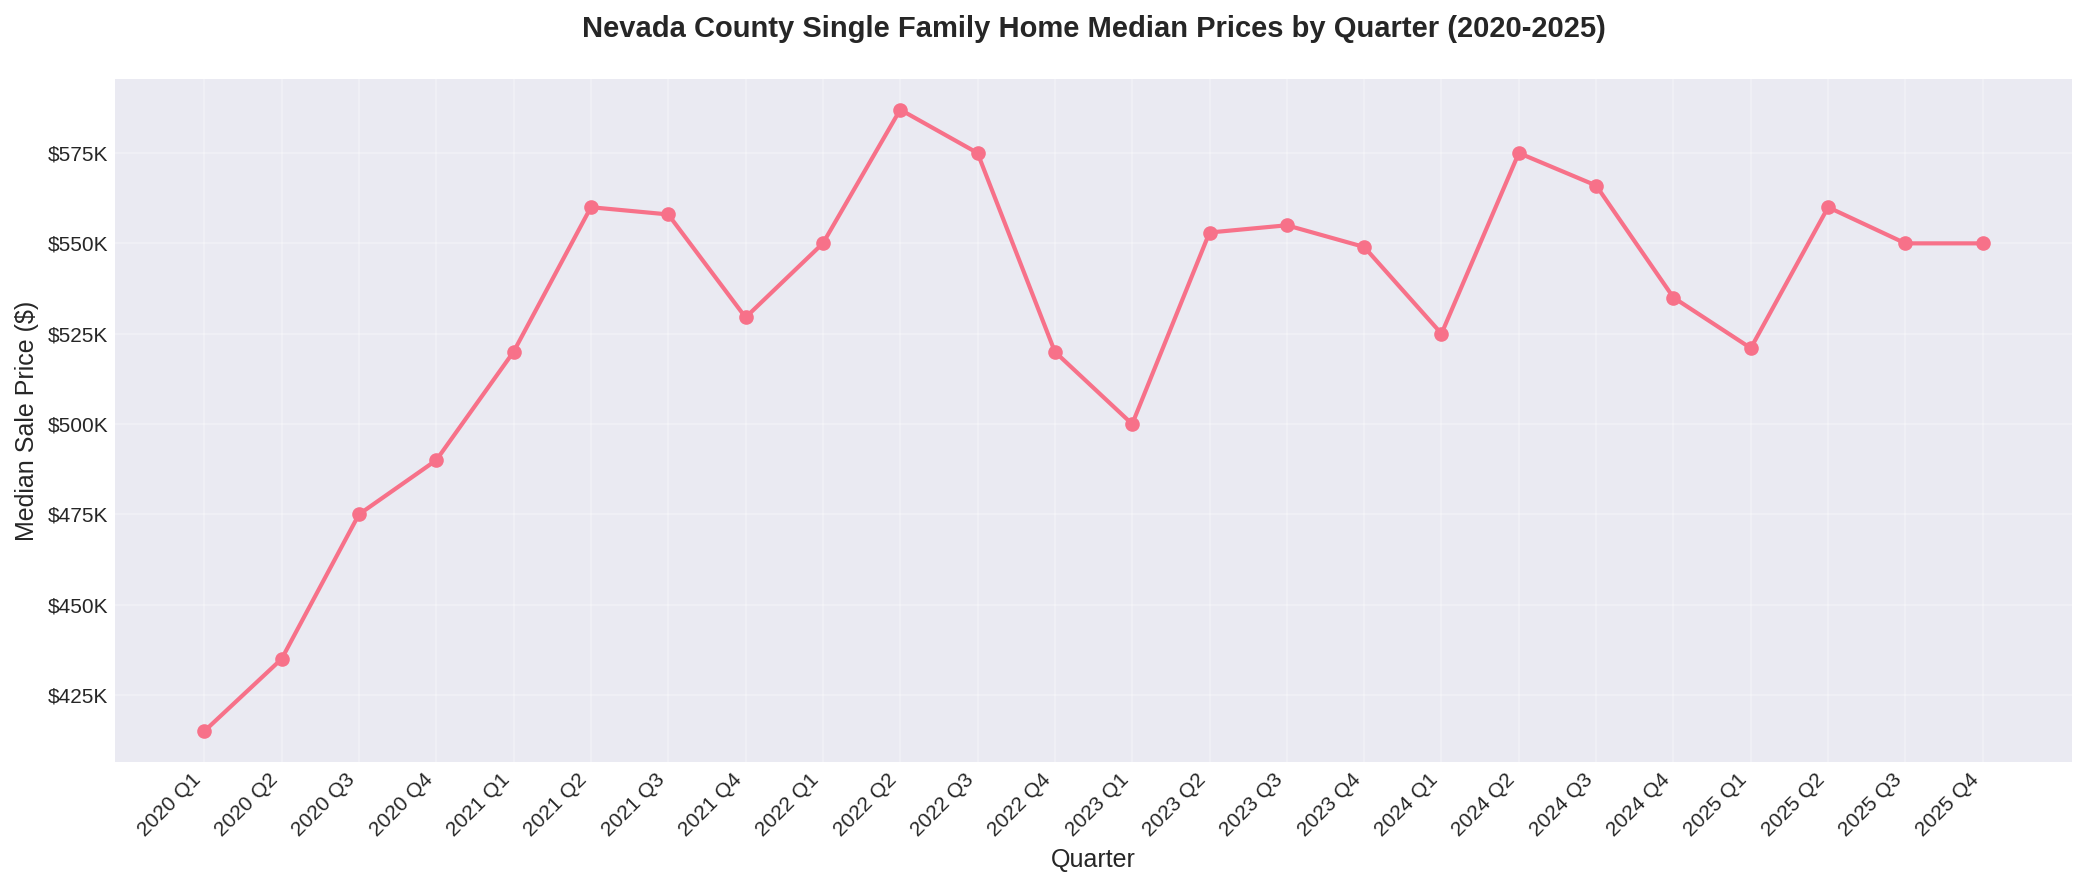
The 2025 market showed familiar seasonal patterns with some interesting variations:
Q1: Median $521,000 (weakest), 202 sales (slowest)
Q2: Median $560,000 (strongest), 291 sales
Q3: Median $550,000, 328 sales (highest volume)
Q4: Median $550,000, 275 sales
Unlike 2024, when Q2 showed the strongest pricing, 2025 saw remarkable price consistency from Q2 through Q4, all landing at or near $550,000. The spring/summer season (Q2-Q3) accounted for 56% of annual sales, consistent with Nevada County's historical patterns.
What It Means
Six years after the pandemic began reshaping the housing market, Nevada County has found a new equilibrium. The data tells a clear story:
Price stability is the new normal. For four consecutive years (2022-2025), median prices have stayed within a $549,000-$565,000 band—a variation of just 3%. Compare this to the 29% surge in 2020-2021 or the steady 4-7% annual gains of the 2012-2019 recovery.
Volume is recovering, slowly. After the 2023 trough, sales have increased two years in a row (+2.4% in 2024, +4.2% in 2025). The pace suggests a gradual normalization rather than a rapid return to pandemic-era frenzy.
The market is more normal. Days on market, while lengthening, remain reasonable. Homes still sell—they just take a month instead of a week. Buyers have time to make informed decisions. Sellers who price appropriately are finding qualified buyers.
Migration Patterns Support Market Stability
New IRS data from 2021-2022 (the most recent available) reveals the demographic forces underpinning Nevada County's market resilience. The county experienced net positive migration of 587 households, with incoming residents earning significantly more than those departing.
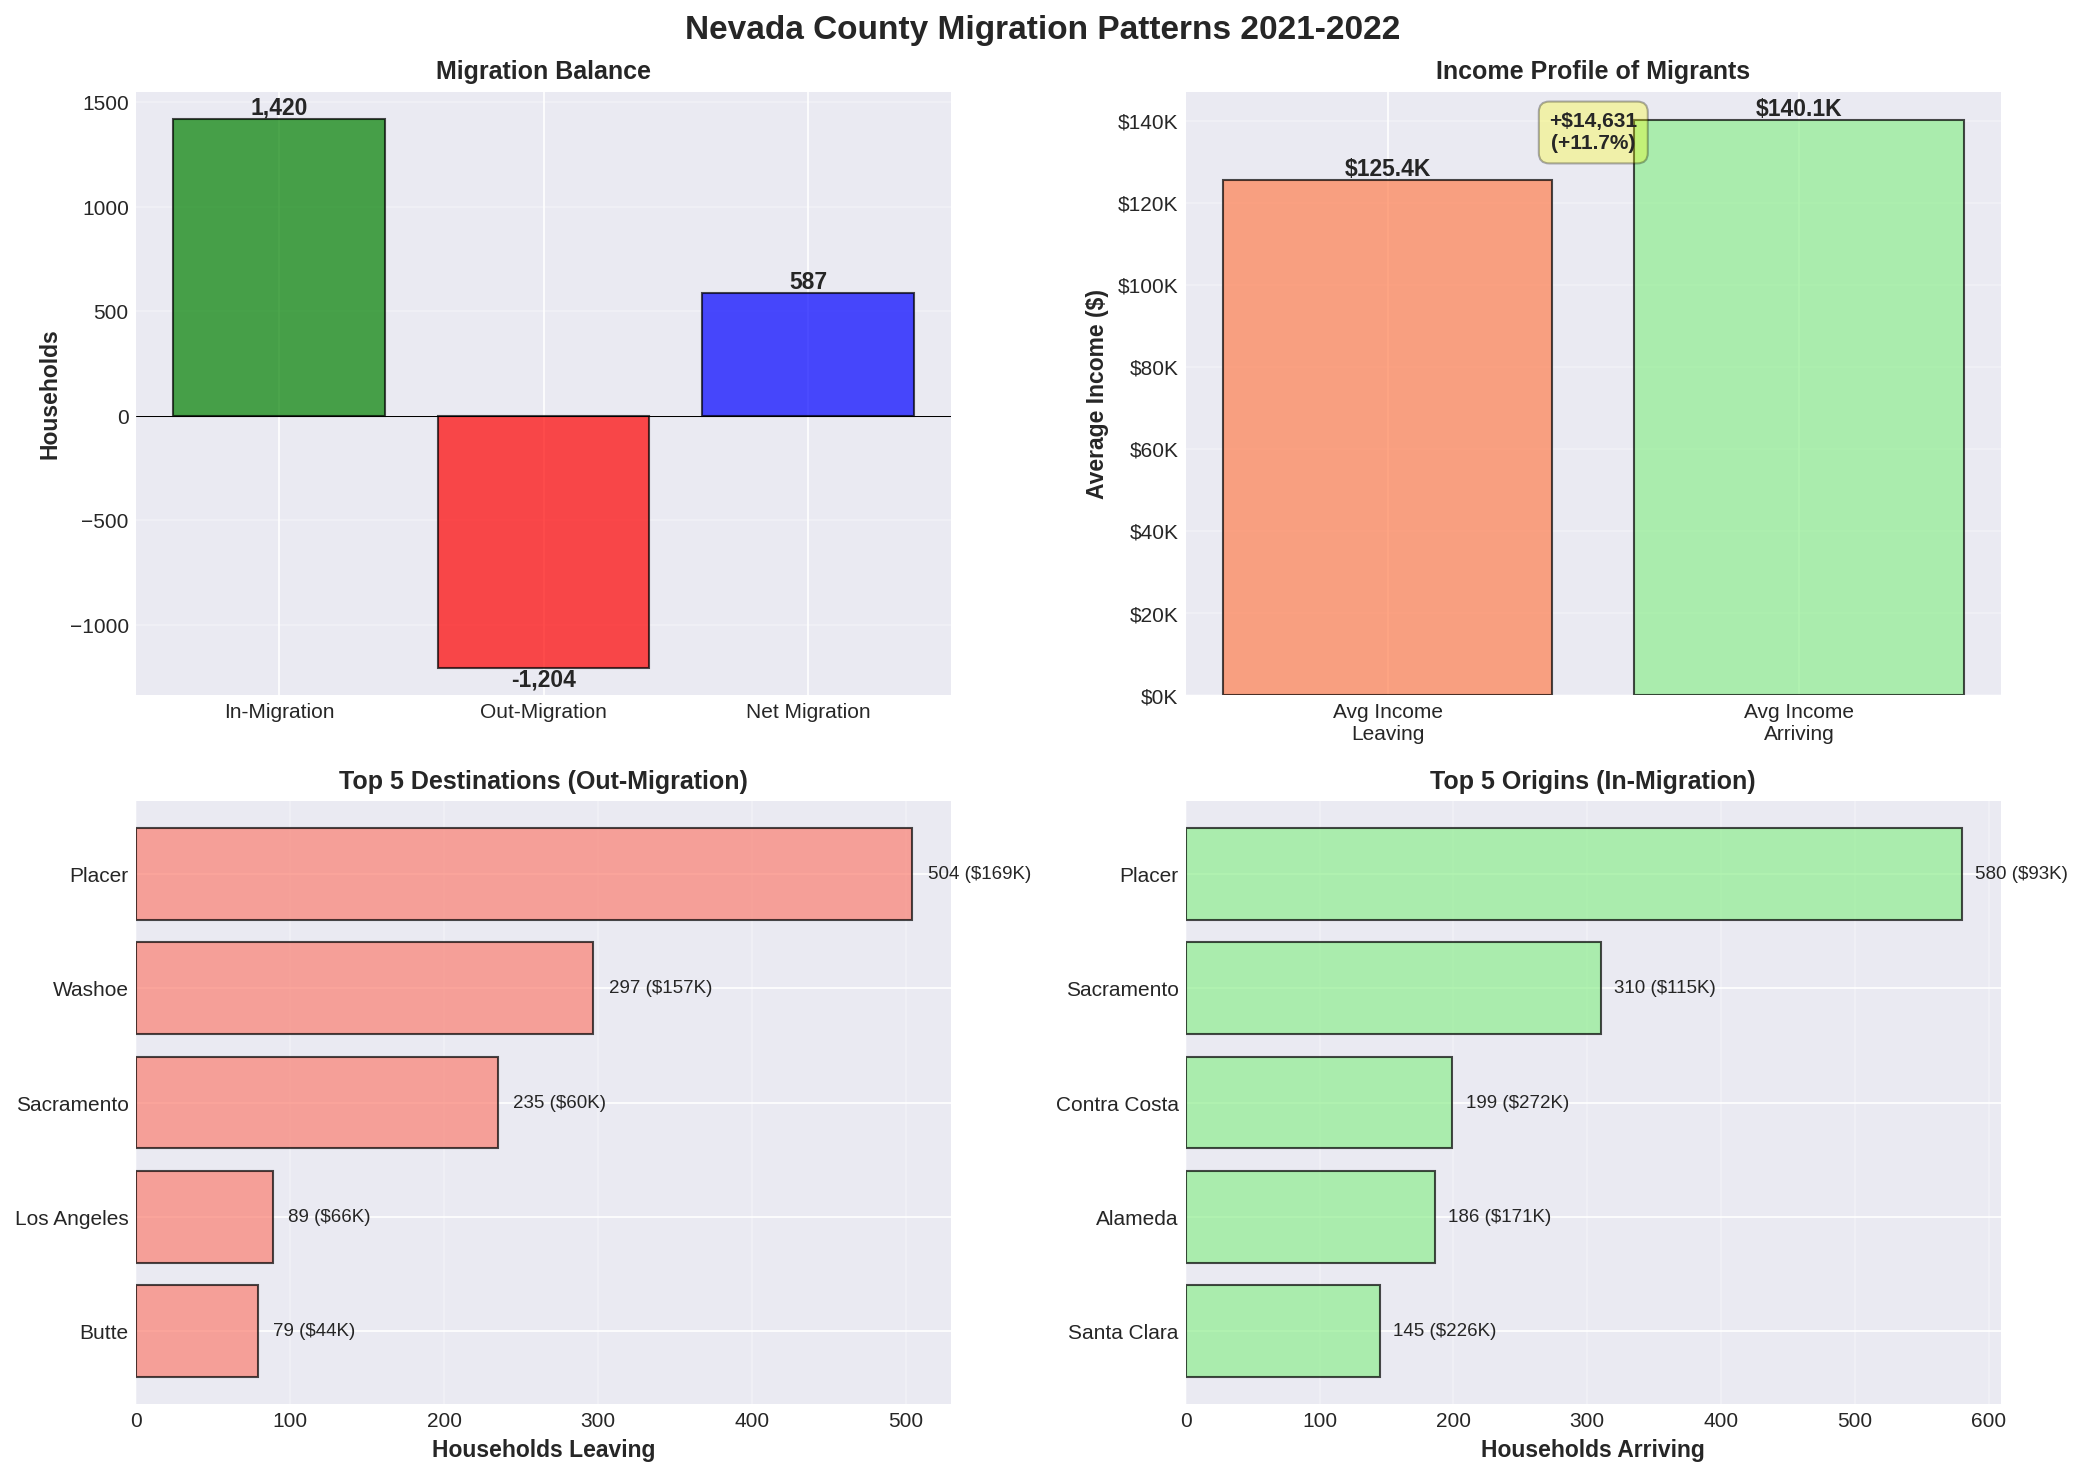
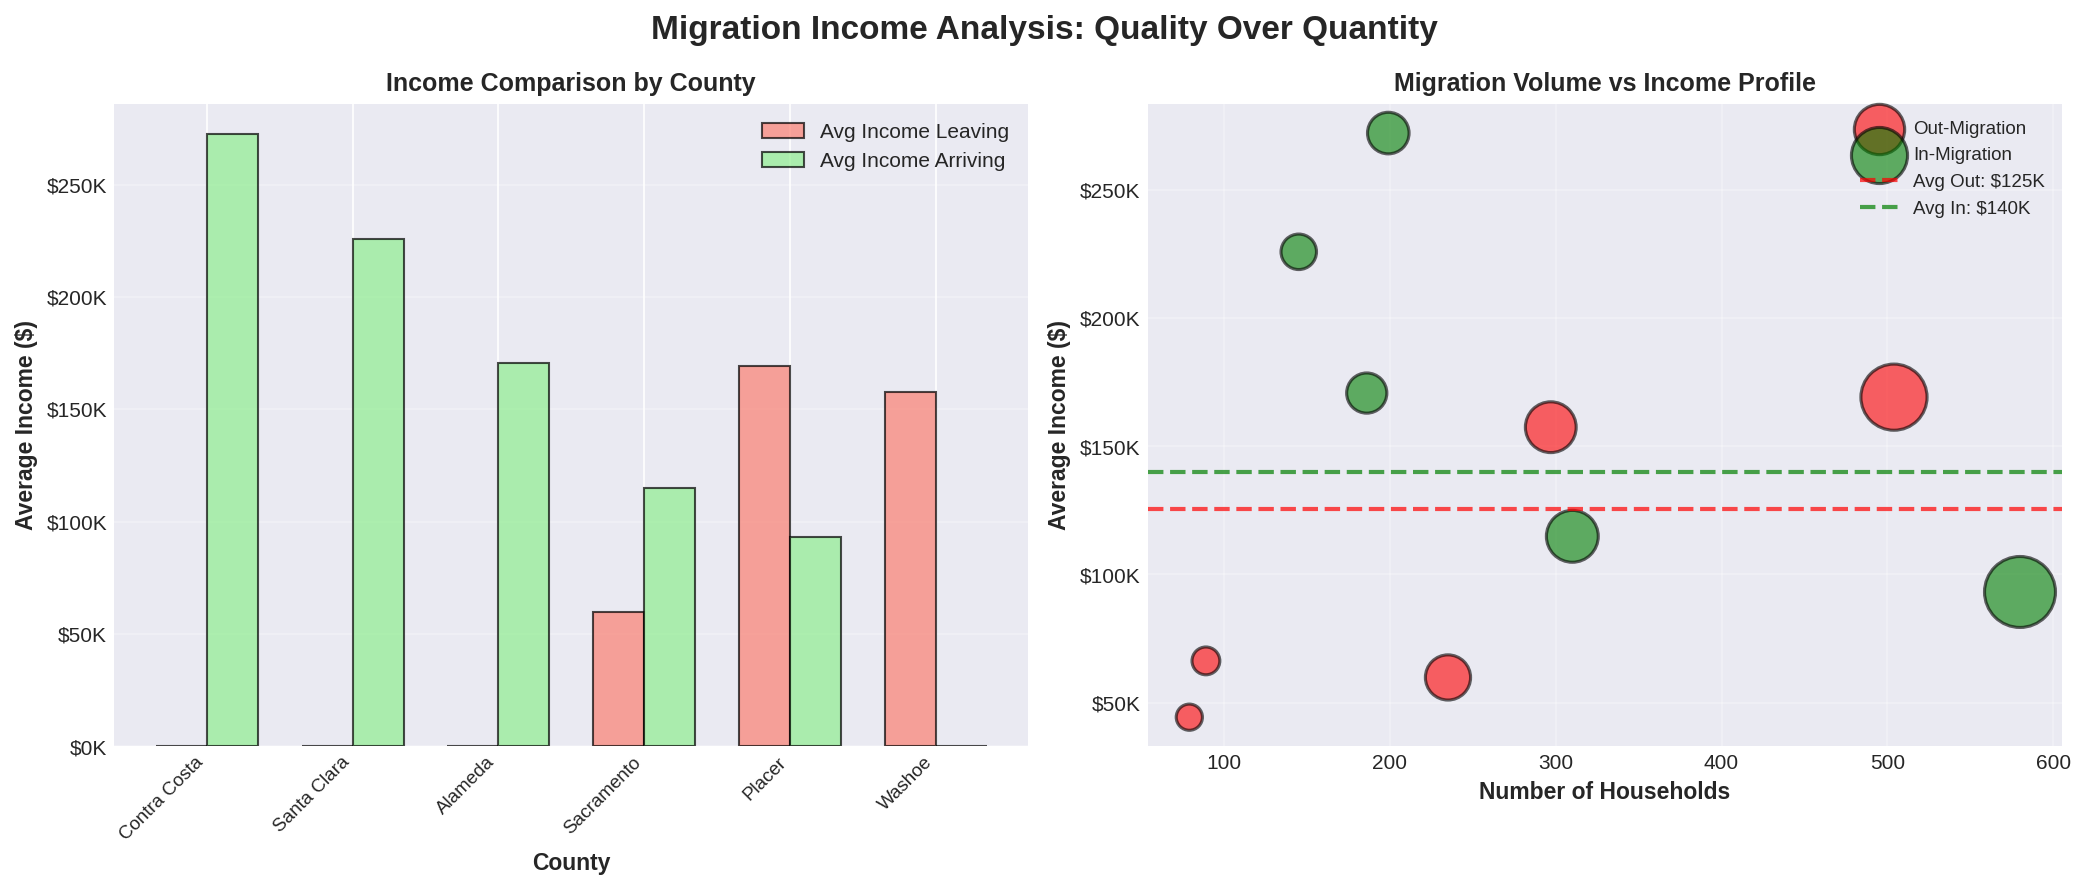
The Income Quality Advantage
Perhaps most telling: households arriving in Nevada County during this period earned an average of $140,067—11.7% higher than the $125,436 average of those leaving. This "quality over quantity" dynamic helps explain why home prices have remained stable despite reduced transaction volume.
Bay Area "Equity Refugees"
The data reveals Nevada County's role as a destination for high-income Bay Area residents:
Contra Costa County: 199 households arriving, $272,296 average income
Alameda County: 186 households arriving, $170,817 average income
Santa Clara County: 145 households arriving, $225,952 average income
These migrants bring substantial purchasing power—dramatically above Nevada County's median home price of $550,000—and often arrive after cashing out of million-dollar Bay Area properties.
The Placer County Exchange
The largest two-way flow is with neighboring Placer County:
580 households arrived from Placer (avg income: $93,176)
504 households departed to Placer (avg income: $169,216)
Net gain: 76 households to Nevada County
This bidirectional flow suggests lifestyle arbitrage: some Nevada County residents trade up to Placer's more urban amenities, while others arrive from Placer seeking Nevada County's more rural character at a relative discount.
Sacramento Metro Connection
Nevada County gained 75 net households from Sacramento County, with those arriving ($114,903 average) earning nearly double those departing ($59,817). This pattern reinforces Nevada County's position as an "upgrade" destination for Sacramento-area residents.
Timing Matters
Critically, this 2021-2022 migration data captures the peak of Nevada County's pandemic price surge—precisely when the market needed demand most. While we don't yet have 2023-2024 migration data, if patterns held even partially, they would help explain why prices stabilized rather than corrected more sharply when interest rates rose.
Key Takeaways for 2025:
Buyers: A more balanced market with time to shop, but no price relief in sight
Sellers: Realistic pricing and patience required; premium pricing opportunities rare
Market: Transitioning from "recovery from correction" to "new normal"
Looking ahead to 2026, the fundamentals suggest continued stability. Nevada County's lifestyle appeal, limited inventory, and strong local employment support prices. But the urgency-driven appreciation of 2020-2021 appears to be behind us. Barring major economic disruption or dramatic interest rate changes, expect more of what we've seen: prices holding near current levels, volume gradually improving, and a market that rewards patience over panic.
Understanding Submarkets
These metrics represent the entire western Nevada County market as a whole. It's important to remember that homes typically compete within a submarket—not the entire county. In every appraisal project I work on, a careful analysis is completed with a minimum analysis on a county level, area level, and the competitive market for properties that directly compete with the property being appraised. Your home's value is most influenced by its immediate competition: similar homes in your specific neighborhood, school district, or geographic area. Market-wide trends provide context, but submarket conditions determine actual values.
Data based on Nevada County MLS closed sales of single-family residences, 2020-2025. Analysis includes properties priced between $50,000 and $5,000,000. 2025 data reflects sales through December 31, 2025.