
New Year, New Market?
Last week I woke up to the alarming news from the National Association of Realtors that existing home sales are down 10.3% from last year and were down 6.4% from November. Is the sky falling? Has the $#@% officially hit the fan? Is this 2007 all over again?
Pump the breaks. National and regional trends play an essential role in the analysis of the greater housing market and what the future may hold, but we need to look at local data for the most relevant trends. Today I’ll analyze some of the patterns for the Nevada County market as a whole. For specific market updates, I’ve updated the Nevada County Market Updates page for each region. Its a great source of independent data to show buyers and sellers what's going on in the specific neighborhood. I utilize market-specific data in all appraisals in Grass Valley, Nevada City, and the surrounding areas.
Year over Year Analysis
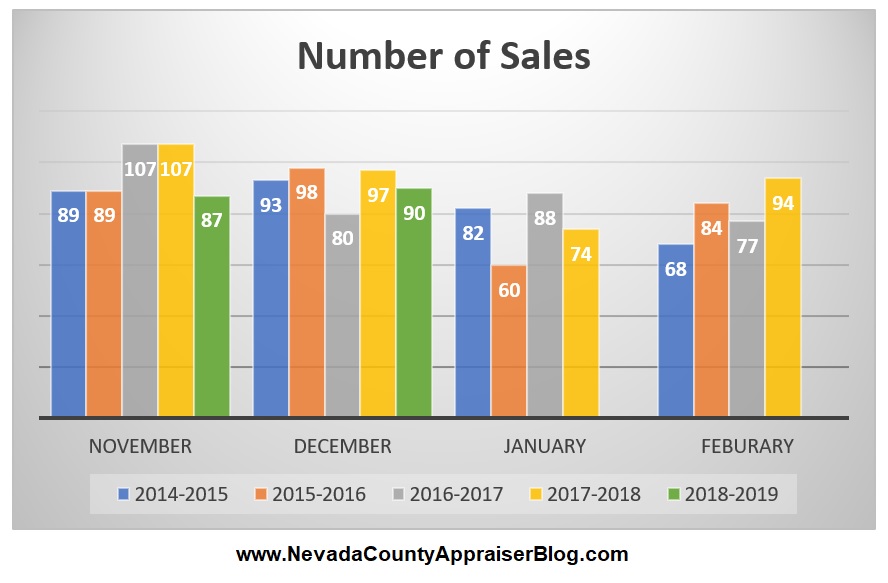
The number of sales in Nevada County was down 7.2% from December 2017, but actually went up 3.4% from November. January and February are traditionally the slowest months of the year so don’t be too concerned if the market seems slow.

New listings in Nevada County shot up in both November (+17.8%) and December (+20.6%) over 2017. The increase in new listings indicates the market may be sensing that now is the time to capitalize on the maximum equity. This also means there is going to be more competition. Will 2019 be more of a buyers market?
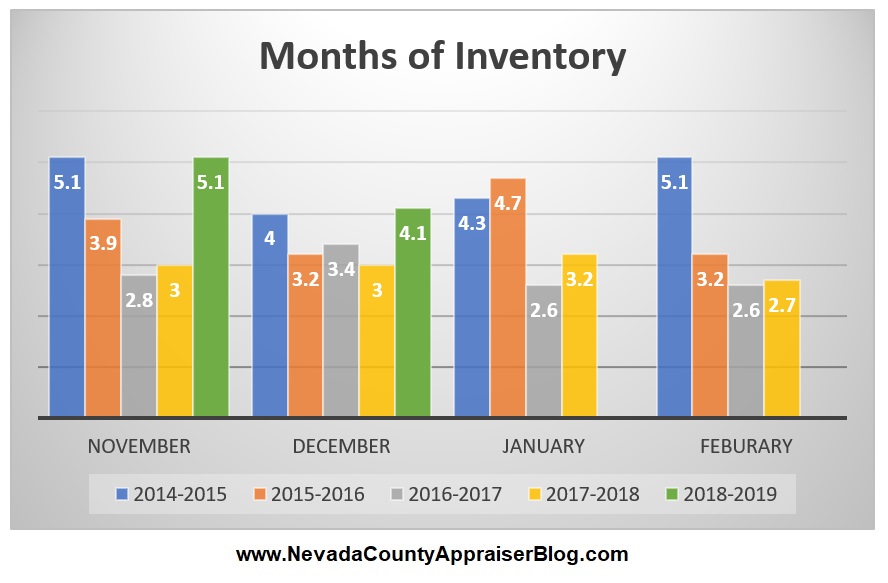
With fairly steady sales and a jump in new listings comes an increase in months of inventory. Months of inventory jumped 70% in November and 36% in December vs. this time last year. The last few years have been an overall shortage. Today’s Nevada County market, as a whole, appears to be balanced.

Average Days on Market did increase from November (+27.2%) and is up from December 2017 (+52.2%) but still remains a typical marketing time range. Average DOM typically increases in January and February.
What About Prices?
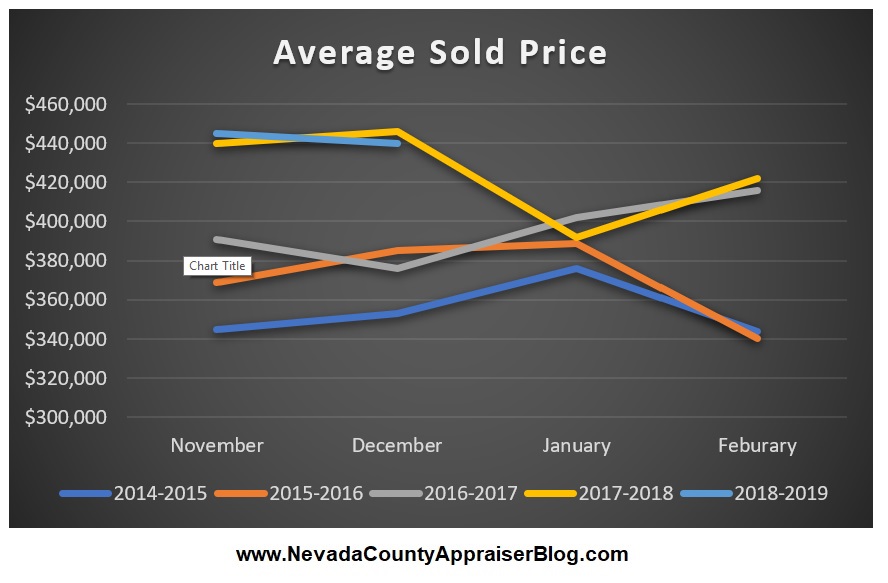

Average and Median Sold Prices remain consistent with 2017 in January and December. 2017 and 2018 sold prices were substantially higher than 2014-2016.

The average active price for 2018 is in the middle of the pack. This may be due to realistic expectations of the market’s current inventory and competition.
Summary
Overall, the current Nevada County market appears to be pretty stable with a slight increase in active listings and overall inventory. Median and Sold Prices and the number of sales is remarkably consistent with 2017. Days on Market has slightly increased but remains at a reasonable level.
How Far We’ve Come
Take pride in how far you've come. Have faith in how far you can go. But don't forget to enjoy the journey - Michael Josephson
Below I’ve highlighted specific price ranges and the number of sales each ear since 2010.

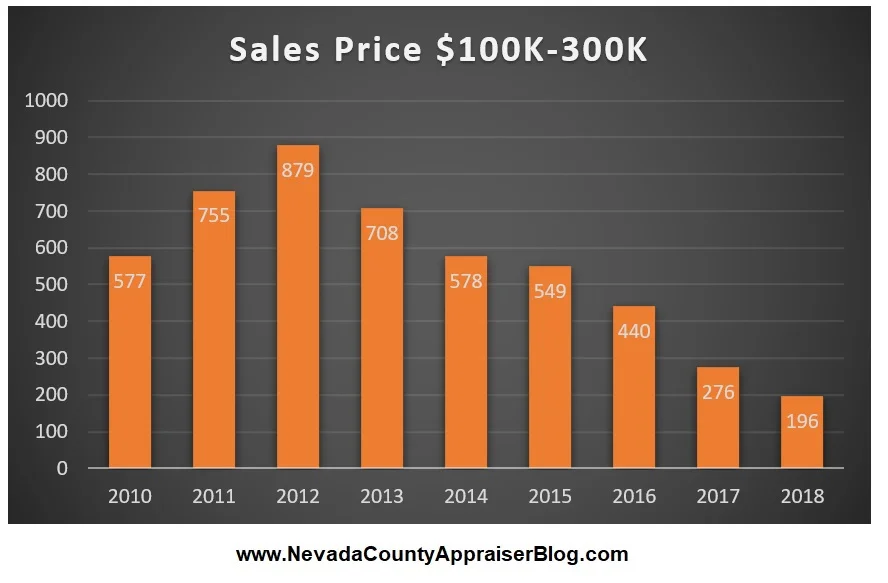


These graphs show how the affordability of homes in Nevada County has changed since 2010 and how the higher end market has dramatically expanded.
As always, if I’ve missed anything or if you have any general comments, please feel free to comment below or email me at brian@snappraisal.com. I love to hear feedback!

