

Housing Data since 2000 in Nevada County
A friend of mine, Ryan Lundquist, recently analyzed the Sacramento housing market over the last 20 years in his Sacramento Appraisal Blog. This breakdown provides helpful and interesting insight into various Sacramento County markets. Ryan particularly notes when the peak and bottom of the market occurred, and what the recovery has been like. Inspired by this analysis, I thought it would be good to look at Nevada County as far back as the data in MLS goes, which is September 15, 2000. This should give a good outlook pre and post the Great Recession and how sales compare today. This can help homeowners realize how far the market has recovered if they are considering selling, refinancing or even obtaining an equity line.

Things to keep in Mind ...
It can be dangerous to interpret data trends and apply them to a specific market or subject property. If the monthly median sale price for all homes in Nevada County has increased 16% in the prior year it means just that; the middle sales price of the (on average 113) sales that month has increased 16% when comparing July 2017 to July 2018. If you look just one month back from June 2017 to June 2018 the data indicates a 5.5% increase. The moral of the story is that data itself can be misleading without analysis.
First lets look at every sale in the county since September 2000
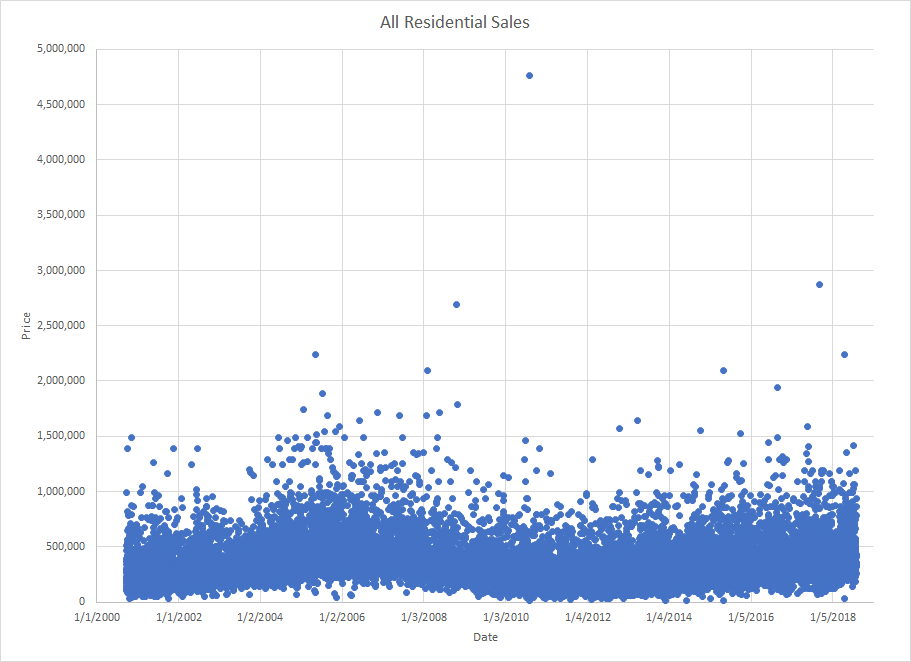
Looking at this chart tells me a few different things. Sales range from almost $0-$5,000,000 over the past 18 years which is a HUGE range. The data also shows that most sales are under $2,000,000. There appears to be a peak at the beginning of 2006 and a bottom in 2012.

Since most of the sales in the county are under $2,000,000, I've enlarged the graph and added a moving average trendline. This trendline indicates there was a peak in the market in early 2006 and the bottom of the market was in early 2012. The graph also shows on average, values are getting closer to the peak in 2006.

This is a 5th Order Polynomial Trendline I've chosen that best represents the trend. Don't be scared by the tail at the end, I've purposely told it to trend down at the end of the data. The trendline tells us the peak was in March 2006 with a value of $495,000. Current data along the trend and as of June 2018 shows we are at $455,000. This means the trend indicates values are currently about 92% of what they were at the peak.

The bulk of Grass Valley Sales are under $800,000 and indicate a peak trend value of $420,000 in March 2018 and are currently at $410,000. This indicates values are 98% of what they were at the peak.

In Nevada City, the trend value was $554,000 at the peak and currently at $510,000. This indicates values are 92% of what they were at the peak.
In Summary
Data shows the peak of the market was early 2006 and the bottom of the market was in 2012. This is not earth-shattering, as most real estate professionals knew this already. Nevada County has experienced quite a recovery from the bottom of the market in 2012. On average most homes are almost, but not quite, worth as much as they were at the peak of the market.
This data is great for an overall trend when speaking about the Nevada County market as a whole. As we all know, Nevada County has many different sub-markets and sub-markets of sub-markets. The market for an estate style home on Banner Mountain is different than an old miner's shack in downtown Grass Valley. When writing an appraisal, an appraiser will analyze the market for that specific subject property as well as overall general market trends. If you have questions on what the competitive market is doing for a specific property, it's always best to have an appraisal.
Be sure to check out the Nevada County Market Updates where I highlight the areas of Alta Sierra, Peardale/Chicago Park and North San Juan. There should be a market report for most markets in Nevada County. This shows a current 2 year analysis of the overall Nevada County market and a detailed 1 year analysis of the sub market.
If you ever have any questions or comments feel free to call/text me at (530) 632-3428 or by email at brian@snappraisal.com.
