

Predicting the Future - Part 2
The Magic 8 Ball
Fortune Cookies, Tarot Cards, Ouija Boards, and Magic 8 Balls all make the promise of telling the future. If I were a Magic 8 Ball and someone asked what the future of the Nevada County housing market looks like, my response might be ‘Focus and Ask Again’ or ‘We Better Wait and See.’
In Part 1 of the series, we took a look at basic economic theory of how prices worked; the effect of supply and demand. And based on current supply and demand, the Nevada County housing market has remained strong, with a limited supply and high demand. In my daily appraisals in Grass Valley and Nevada City, I continue to pay close attention to months of inventory and marketing times. For Part 2, I will analyze factors that affect supply and demand, namely unemployment, interest rates and recessions.
Unemployment
Living without steady employment can effect one’s ability to pay for the most basic needs- food, clothing, shelter etc. It is no surprise, therefore, that the unemployment rate has an affect on the housing market. We can see this firsthand by analyzing unemployment and housing during the past few recessions since 1990.

Nevada County’s unemployment rate peaked at 12.2% at the beginning of 2010. This was immediately following the recession of 2008-2009 (A recession is technically defined as a fall in Gross Domestic Product in two successive quarters). During that recession, unemployment jumped from 5.2% to 10.6% in Nevada County. Unemployment also jumped during the recession in the early 1990’s in Nevada County. The brief dot-com bubble and 9/11 recession in 2001 only slightly impacted Nevada County.

The Civilian Labor Force (defined as the sum of employed and unemployed non-military citizens over the age of 16) in Nevada County had been growing steadily until the 2008-2009 recession. Unemployment jumped and the labor force shrunk due to forced retirement and relocation.

As unemployment began to rise in 2007, immediately so did distressed sales (foreclosures and short sales). At its peak in February 2011, distressed sales accounted for 65.3% of sales in Nevada County when the unemployment rate was 11.7%.
Unemployment adversely effects both supply and demand. If someone doesn’t have a job, they most likely aren’t in the market to buy a new home, which decreases demand. Also, if someone is unemployed and can’t pay their mortgage, they may have to short sell or face foreclosure. This increases the supply of homes on the market. Much of the cause for the distressed sales and recession of 2008-2009 was directly impacted by unemployment.
Currently, Nevada County has a very low unemployment rate. If unemployment starts to rise, we can expect to see slowing demand and potentially rising supply in the housing market.
Interest Rates
Today there are many different types of interest rates and they all fluctuate. Most revolve around the Federal Funds Rate which is the rate at which banks borrow money from the Federal Reserve (aka The Fed). The Fed manipulates the Federal Funds Rate as one of they many tools they have to control the economy. Typically the Federal Funds Rate stays low for an extended time period after a recession as a way to jump start the economy, making it easier for banks (and people) to borrow money. Interest rates have risen slightly in the past year but historically remain quite low.

However, from 2004 - 2006 Adjustable Rate Mortgages (ARM’s) accounted for approximately 50% of all loan volume. While each individual ARM worked slightly differently, most had a low introductory rate that would change to an adjusted rate in a certain time period. If you obtained a 5/1 ARM in 2005, you may have had a fixed introductory rate of 2% for the first 5 years. However, in 2010, that interest rate would have suddenly adjusted to 7 or 8%. If you had a $400,000 loan, your payment could go from $1,450 to $2,800 in one month. Combine that with the possibility you may have lost your job, and you’d be forced to either short sell your home or go through foreclosure. Luckily, ARM’s account for very little of the current market. We can now analyze how these types of mortgages have influenced housing supply and demand over the last decade or so.
Yield Curve
I recently attended a seminar with Mark Zandi, Chief Economist of Moody’s Analytics. The seminar focused on the current and future state of the US economy and housing market. Zandi talked about analyzing the yield curve to help predict recessions. A yield curve plots interest rates of bonds that have different maturity rates.
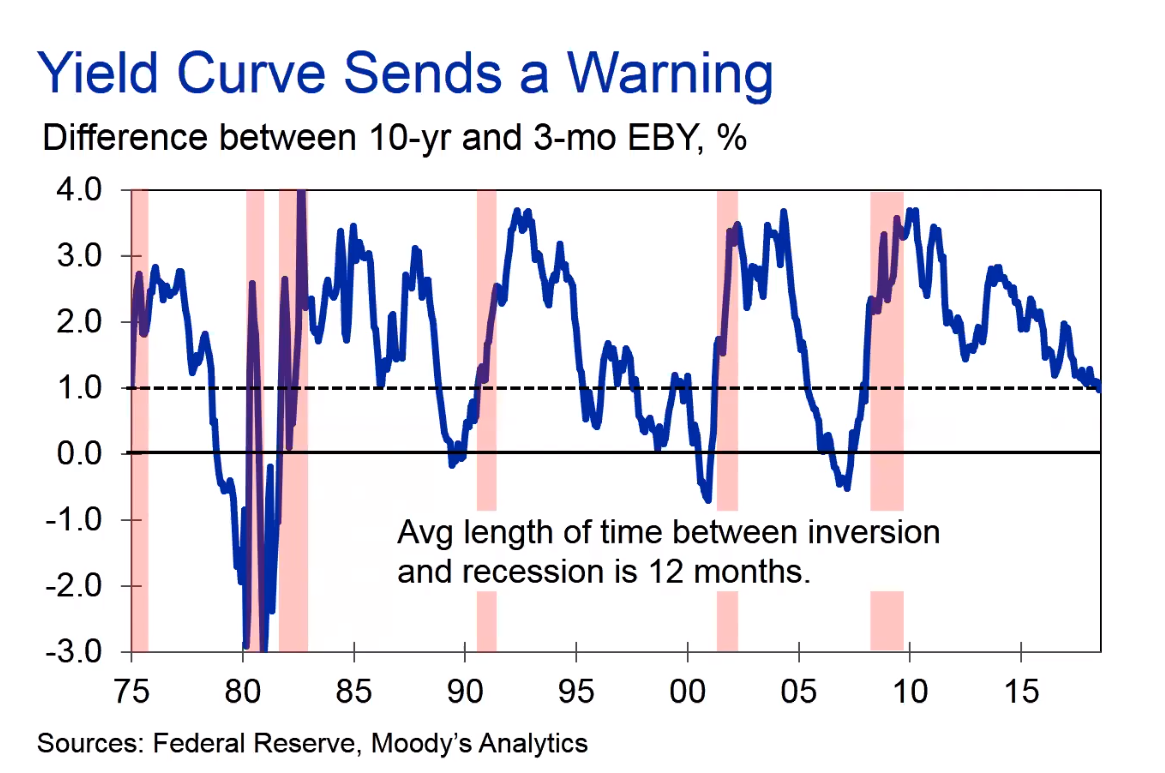
The yield curve (between 10 year and 3 month bonds) predicted recessions in 1980, 1981-1982, early 90’s, early 2000’s and in 2008-2009. Currently, this curve indicates there is little motive to invest in long term bonds. We are beginning to see the yield curve indicate a recession on the horizon. Zandi predicted the US would be in a recession by November 2020. You can read more about the yield curve theory at Forbes, Bloomberg and Jim Cramer of CNBC.

Speaking of Recessions…
How have previous recessions affected Nevada County’s housing market? The results are mixed. Monthly sales dipped slightly after the recession in 2001 but rebounded to almost an all-time high with 174 sales in June 2004. The recession of 2008-2009 brought some of the slowest months on record in January 2008 (38 Sales) and February 2009 (42 Sales).

The Housing Price Index for Nevada County shows that housing prices were unaffected by recessions in 1980 and the early 2000’s. Prices stagnated following recessions in 1981-1982 and the early 1990’s. The Great Recession of 2008-2009 was in the middle of a large decline in prices.

A closer look at individual sales show similar data that price trends were unaffected in the recession of the early 2000’s but a significantly declined in 2008-2009.
What other Experts Are Saying …
“My take is that we may be in for slower rate of value growth in the next few years, depending on stability of state and national economies. Demand does not seem to be flagging, however, inventory is trending upward. Rising interest rates will also tend to hold down value growth. The current inventory of unsold homes includes an increased percentage of homes that have had price reductions.
My projection for the longer term is optimistic. Historical trends plus benefits I believe will accrue from improved high speed communications should affect a positive value trend in Nevada County.” -Charlie Brock, Grass Roots Coldwell Banker
“I feel we are seeing a correction in the market at the moment. Rates increasing can slow things down and can allow for the inventory to grow as it take some of the buying power out of the Buyers hands. We are also heading into the "slower season" of our market as the holidays are right around the corner. It will be interesting to see how 2019 handles rates, supply and demand. Spring will be a good indicator of how next year is going to go in my opinion.” -Jamie Barber, Network Real Estate
In Conclusion
The unemployment rate can influence the supply and demand of the housing market. Currently, the unemployment rate in Nevada County is near an all-time low at 3.4% but should be closely monitored for any significant changes. Interest rates are controlled by the Federal Reserve to boost the economy and stem inflation. Current interest rates have started to rise but remain near historic lows. The yield curve indicates the difference between short term and long term bond interest rates and can signal if a recession is on the horizon. The current yield curve indicates a recession in the near future but the impact on the Nevada County housing market is unknown. When I complete an appraisal in Nevada County, I always analyze each individual market to keep my finger on the pulse of supply and demand. At the same time, I keep my ears open to what’'s happening on a national level and in neighboring markets to know if change is heading our way.

